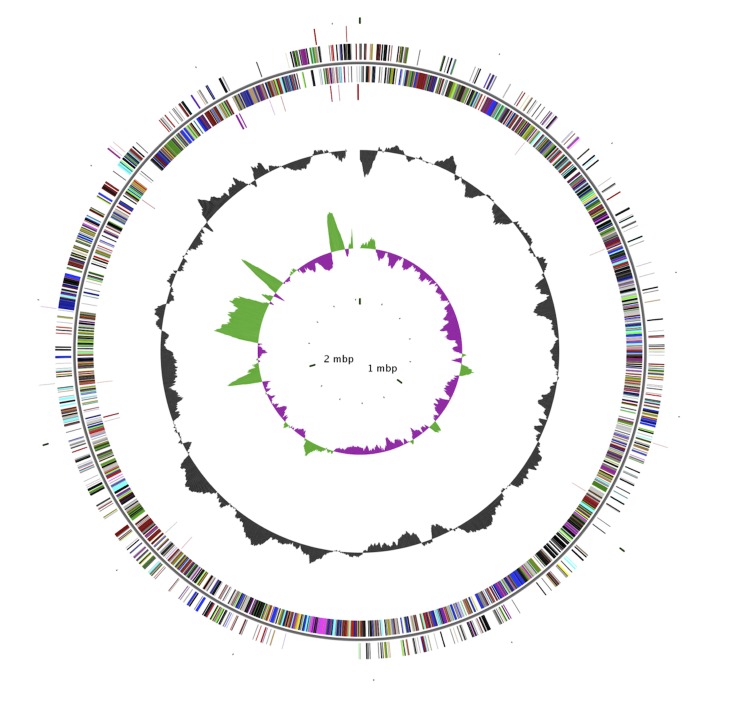
Figure 2.
Graphical circular map of the chromosome. From the outside to the center: RNA genes (tRNA red, rRNAs purple and sRNA black) on the forward strand, genes on the forward strand (colored by COG categories), genes on the reverse strand, RNA genes on the reverse strand, G+C content, and GC skew (purple negative values, olive positive values).

