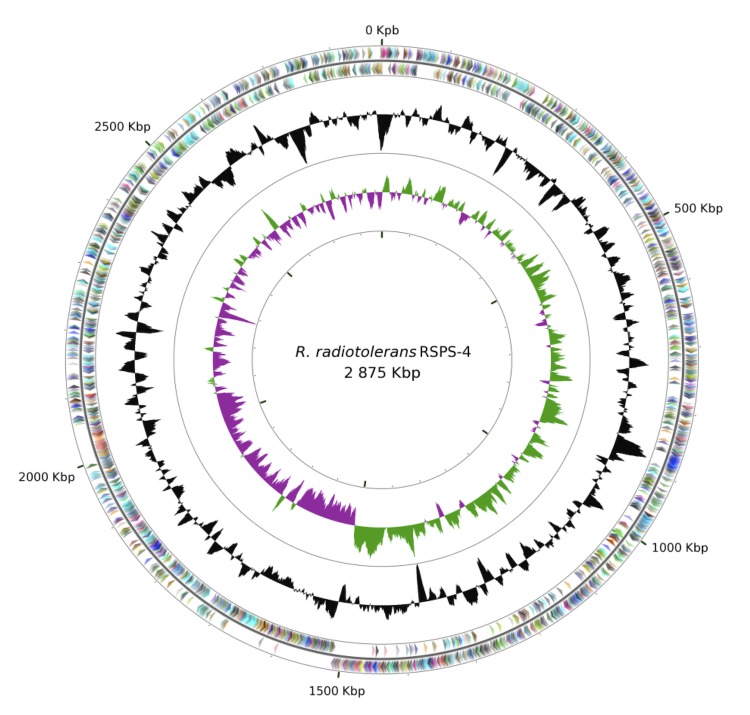
Figure 2.
Circular representation of the chromosome of R. radiotolerans RSPS-4. From outside in, the outer two circles show genes on forward strand and reverse strand, colored by COG categories, the third circle shows the G+C% content plot (colored in black), and the inner circle the GC skew (green and purple). Graphics were created on the CGViewer Server [65].

