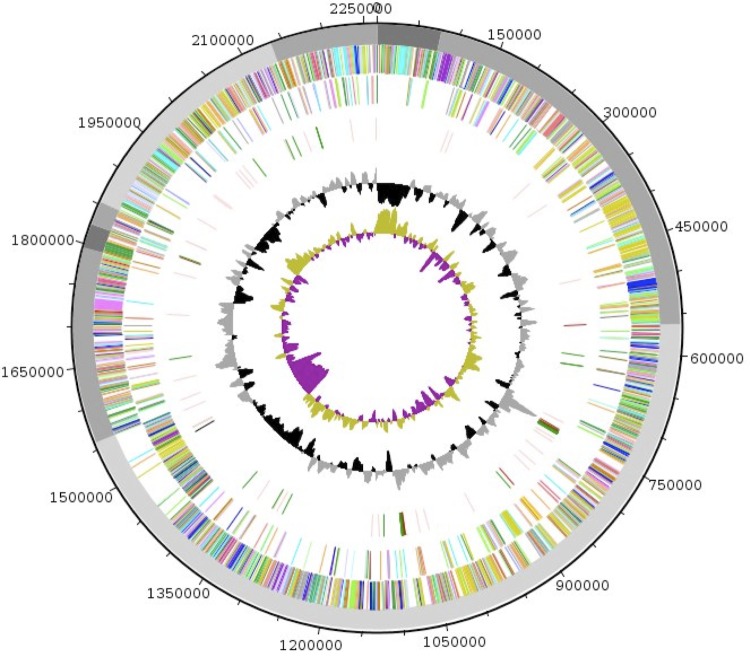
Figure 6.
Graphical circular map of the genome. From outside to the center: scaffolds are in grey (unordered), genes on forward strand (colored by COG categories), genes on reverse strand (colored by COG categories), RNA genes (tRNAs green, rRNAs red, tm RNAs black, misc_RNA pink), GC content (black/grey), and GC skew (purple/olive).

