
Figure 1.
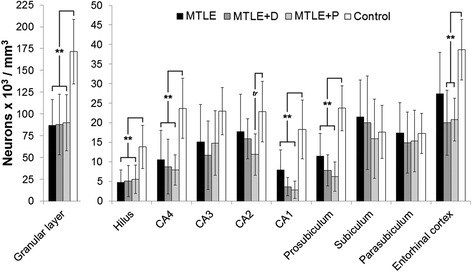
Neuronal density in human hippocampal formation subfields. Neuronal density values from MTLE (black bars), MTLE + D (gray bars), MTLE + P (light gray bars) and from non-epileptic controls (white bars) are indicated as mean ± std. deviation. Double asterisk indicate significant statistical difference (p < 0.001) between epileptics and control group. Neuronal loss was observed in the granular layer, hilus, CA4, CA1, prosubiculum and entorhinal cortex. A statistical trend (tr: 0.05 ≤ p ≤ 0.07) to decreased neuronal density in MTLE + P CA2 when compared to control can also be seen.