
Figure 7.
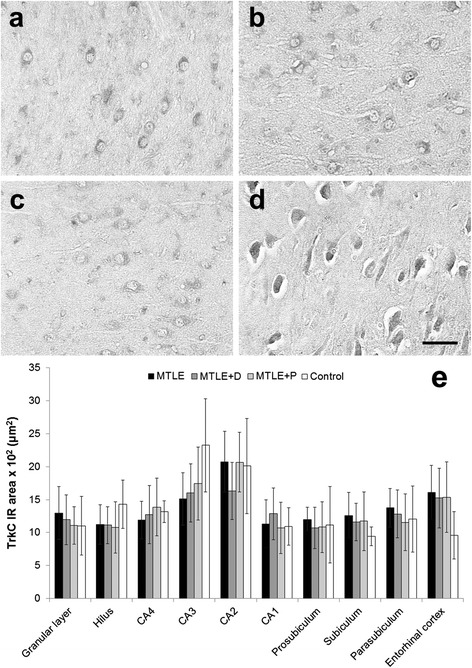
TrkC expression in MTLE specimens with and without psychiatric comorbidities and in non-epileptic controls. MTLE (a) and MTLE + D (b), MTLE + P (c) and control group (d) exhibited predominatly neuronal TrkC expression in CA3. No statistical differences in TrkC immunoreactive area were found among groups (e). Values from MTLE (black bars), MTLE + D (gray bars), MTLE + P (light gray bars) and from non-epileptic controls (white bars) are indicated as mean ± std. deviation. Scale bar (a-d): 50 μm.