Figure 1.

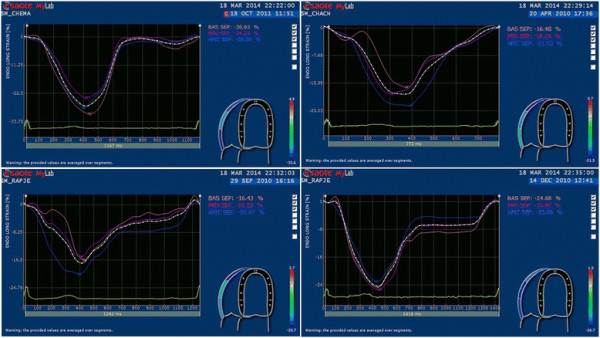
Representative curves for RV global longitudinal strain (%): one control (top left) and one MetS patient (top right), one MetS patient before (bottom left) and after (bottom right) the 3-month life style intervention program.

Representative curves for RV global longitudinal strain (%): one control (top left) and one MetS patient (top right), one MetS patient before (bottom left) and after (bottom right) the 3-month life style intervention program.