
Figure 1.
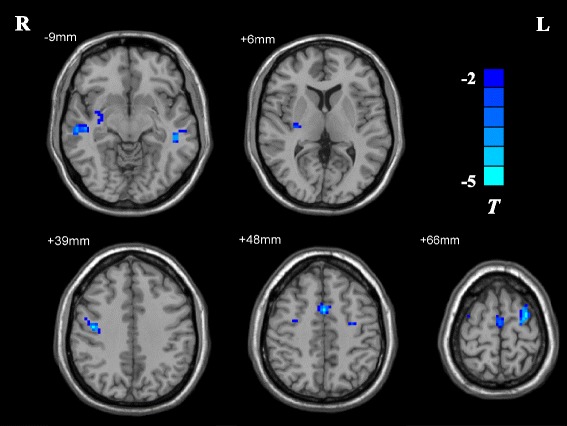
T-statistical different maps between PBD-depression patients and healthy controls (two-sample t test; p < 0.05, AlphaSim corrected). Regions with decreased ReHo values are shown in blue.
Official websites use .gov
A
.gov website belongs to an official
government organization in the United States.
Secure .gov websites use HTTPS
A lock (
) or https:// means you've safely
connected to the .gov website. Share sensitive
information only on official, secure websites.
T-statistical different maps between PBD-depression patients and healthy controls (two-sample t test; p < 0.05, AlphaSim corrected). Regions with decreased ReHo values are shown in blue.