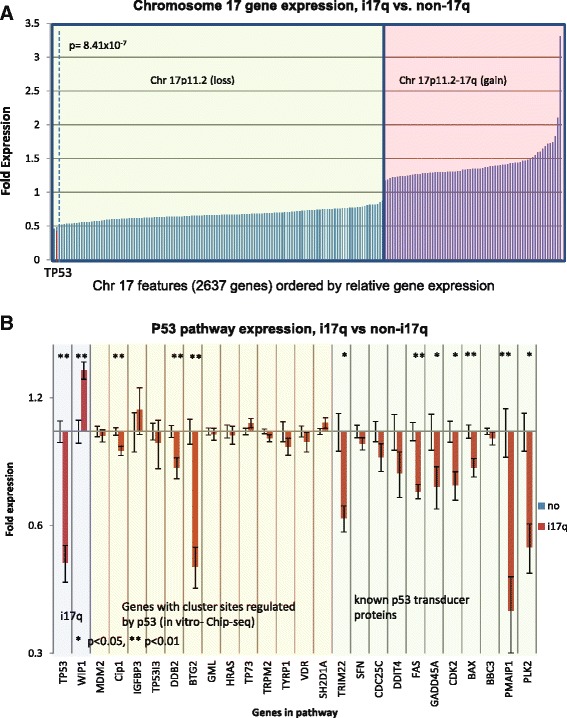
Figure 5.

i17q tumors have significantly altered p53 signaling, and lowered levels of TP53 expression cannot be explained by dosage effects alone. A. Relative expression across all chromosome 17 genes for i17q cases. All features in the 103 MB expression microarray across chromosome 17 in i17q-positive tumors were normalized by negative cases and plotted by fold-expression on the X-axis. The green-shaded box contains all the genes in the hemizygous region telomeric to 17p11.2, while the red-shaded box contains all features centromeric to 17p11.2 and 17q. Although the latter contains more DNA, it is represented by fewer features on the microarray chip. The green box shows that there is a very broad distribution of expression of genes in the hemizygous region, and suggests very uniform lower levels of expression caused by dosage effects. With bonferroni correction, TP53 is significantly reduced in i17q patients (p = 8.41 × 10⁻⁷, t-test). More so, it is expressed at levels greater than 2 standard-deviations less than the average gene in the hemizygous region across all i17q-positive patients, as represented by the red bar. The dotted line represents 2 standard deviations from the mean expression across the hemizygous region of i17q patients. B. Relative expression of genes in the p53 signaling pathway in i17q patients. Fold expression of genes thought to be related directly or indirectly to p53 signaling by chIP-seq experiments or the literature were measured. The blue box contains TP53 and WIP1. The yellow box contains genes identified by chIP-seq experiments to be targets of p53 [51]. The green box contains genes understood to be p53 signal transducers in the literature. A single asterisk represents a p < 0.05 with Bonferroni correction and two asterisks represent p < 0.01. These data demonstrate a significant dysregulation of a majority of p53-related genes in i17q tumors.
