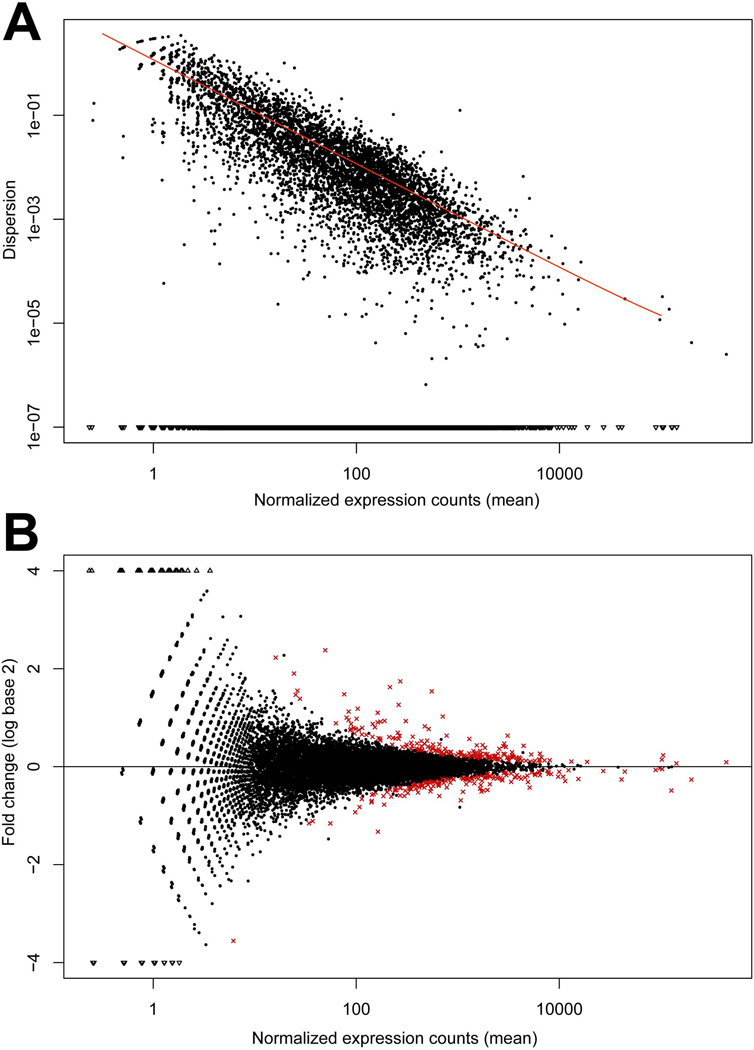
Figure 2. Distribution plots for differentially expressed transcripts in neural folds of ethanol-sensitive (W98S) and ethanol-resistant (W98D) lines in the absence of ethanol treatment.
(A) Normalized dispersion plot showing variance in Read Counts across the W98S and W98D RNA-Seq libraries. Black dots indicate the empirical dispersion. As expected, dispersion decreases as read count increases, as indicated by the fitted line (red). (B). Comparison of transcriptome abundance between W98S and W98D neural progenitors including neural crest. Fold-changes (mean expression W98D – mean expression W98S) are presented as log2. Genes with significantly different expression are shown in red.

