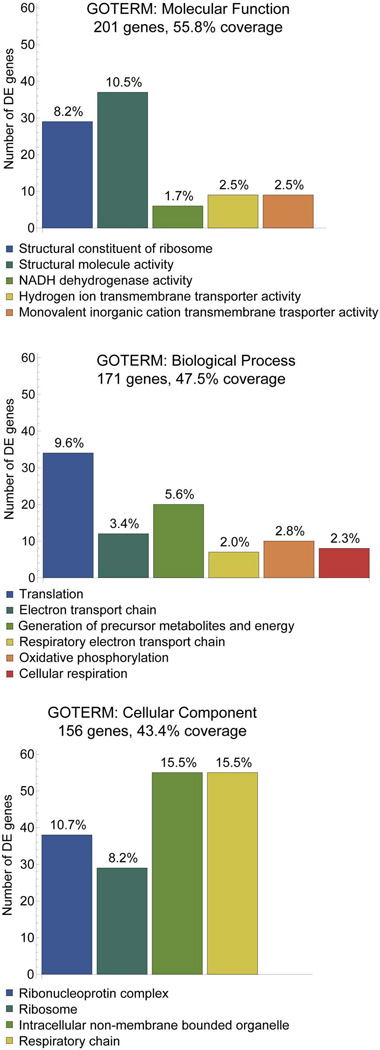
Figure 3. Gene ontogeny modules showing significant differential enrichment in ethanol-sensitive versus ethanol-resistant neural crest and neural progenitors at p≤0.05.
The top enrichments of GOTERMS involved Molecular Function (A), Biological Processes (B), and Cellular Components (C). For each category, the number of transcripts represented out of the 363 DE genes is indicated. For each column the percentage of transcripts within each GOTERM is indicated.

