
Figure 1. Manhattan plots of GWA results.
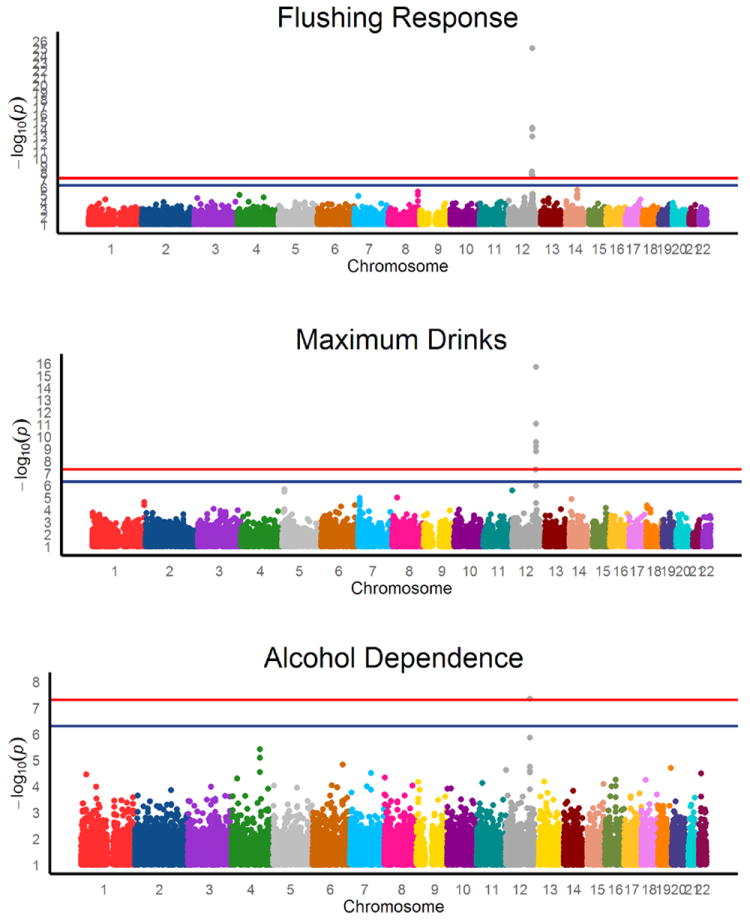
Horizontal lines represent the genome-wide significant (p < 5e-8) and suggestive (p < 5e-7) association thresholds and are held constant across the differing y-axes.
Official websites use .gov
A
.gov website belongs to an official
government organization in the United States.
Secure .gov websites use HTTPS
A lock (
) or https:// means you've safely
connected to the .gov website. Share sensitive
information only on official, secure websites.
Horizontal lines represent the genome-wide significant (p < 5e-8) and suggestive (p < 5e-7) association thresholds and are held constant across the differing y-axes.