
Figure 2. Comparison of rod and cone flash responses in ex vivo and in vivo conditions.
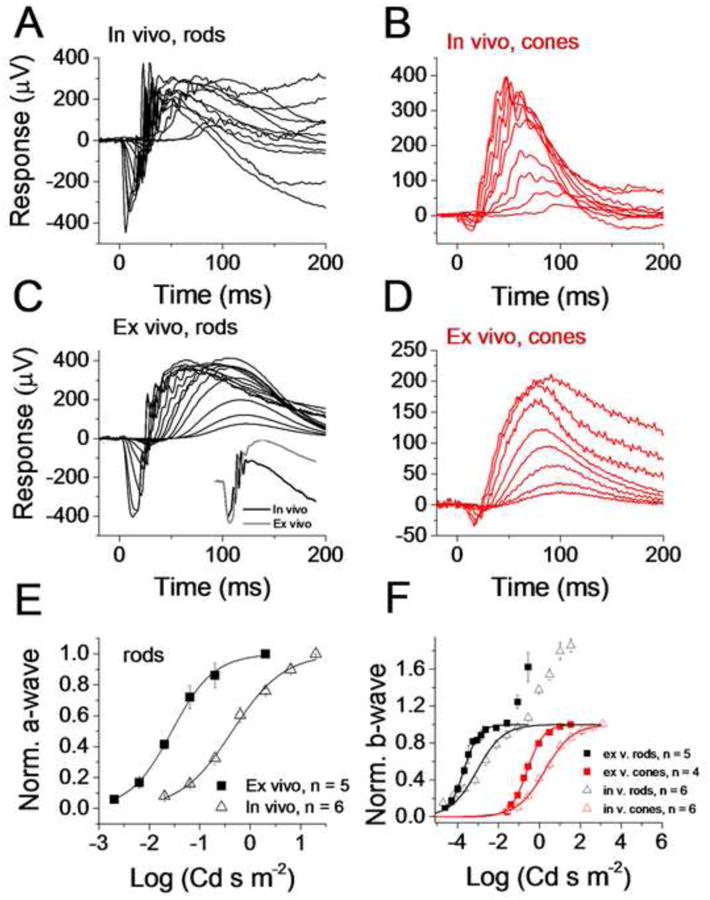
In vivo response families to short flashes of light recorded from WT rods (A) and Gnat1-/- cones (B). For rods, the flash strengths are estimated to be between 0.06 and 115,000 R* per rod. Ex vivo response families to short flashes of light recorded from WT rods (C) and Gnat1-/- cones (D) from retinas perfused with Ames medium. For rods, the flash strengths are estimated to be between 0.16 and 10,000 R* per rod. To compare rod response kinetics, the inset in panel C plots responses to flashes estimated to produce identical 10,000 R* per rod in in vivo (black trace) and ex vivo (grey trace) conditions. (E) Normalized a-wave amplitudes plotted as a function of flash strength from mouse rods in in vivo (triangles) and ex vivo (squares) recordings. The responses have been normalized by the a-wave amplitudes of responses to flash energies of 0.3 and 1.3 log(Cd s m-2) in ex vivo and in vivo conditions, respectively. Smooth lines are best-fitting functions of Eqn. (2) with E1/2 = -1.6 log(Cd s m-2) and n = 1 (ex vivo) and E1/2 = -0.4 log(Cd s m-2) and n = 0.9 (in vivo). (F) Normalized b-wave amplitudes plotted as a function of flash strength from in vivo recordings for rods (black triangles) and cones (red triangles). Same data extracted from ex vivo recordings is shown for rods (black squares) and cones (red squares). Smooth curves are the best-fit Hill-type functions (Eqn. (2)) with the following parameter values: E1/2 = -3.1 log(Cd s m-2), n = 0.68 (rods, in vivo), E1/2 = -3.7 log(Cd s m-2), n = 1.2 (rods, ex vivo), E1/2 = 0.3 log(Cd s m-2), n = 0.65 (cones, in vivo) and E1/2 = -0.6 log(Cd s m-2), n = 1.07 (cones, ex vivo).