
Figure 4. Determination of the rod amplification constant in ex vivo and in vivo conditions.
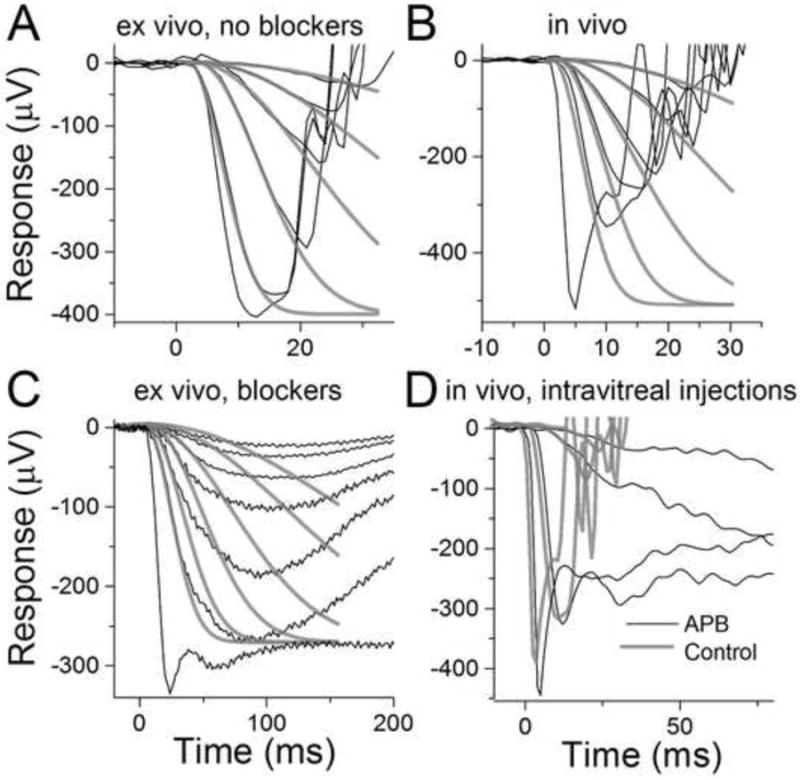
(A) Responses to flashes ranging from -2.6 to 0 log(Cd s m-2) of green light recorded from isolated retina. Grey traces show individual fits of the LP model with td = 2 – 3 ms and A = 11 ± 0.4 s -2 (mean for the 4 dimmest flashes). The rmax has been set to the amplitude of the response to the brightest flash. The A started to decline with flashes exceeding about -0.5 log(Cd s m-2) and was 5.0 s-2 in this retina for the second brightest flash (E = -0.5 log(Cd s m-2)). (B) Responses to flashes of green light ranging from -1.0 to 1.0 log(Cd s m-2) and with bright white xenon flash (20 dB) recorded from WT mouse in vivo. Grey traces show the best-fitting LP model functions with td = 2-3 ms and A = 6.0 ± 0.2 s -2 (mean for the 4 dimmest flashes). The rmax was set to the amplitude of the bright 20 dB flash response. The A started to decline with flashes exceeding about 0.5 log(Cd s m-2) and was 4.6 s-2 for this mouse with E = 1.0 log(Cd s m-2). (C) Responses to flashes from -3.7 to -1.0 log(Cd s m-2) of green light recorded from isolated retina exposed to 50 μM DL-AP4. Fittings of the LP model to the four dimmest flash responses gave A = 32 ± 2 s-2 (mean for the six individual fits) when rmax was set to plateau level after the initial peak. (D) Dark-adapted flash responses recorded simultaneously after intravitreal injection of PBS (grey, left eye) and DL-AP4 in PBS (black, right eye) in WT mouse eyes.