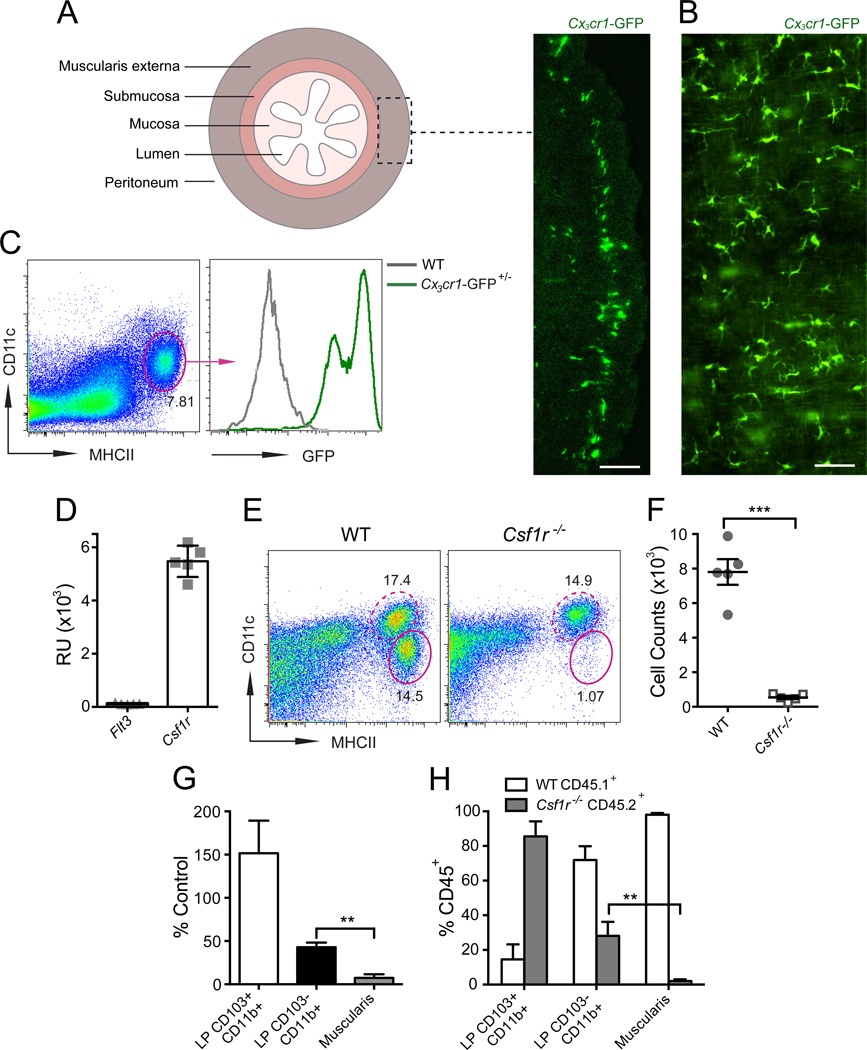
Figure 1. MHCII+CX3CR1+ MMs require CSF1R signaling for their development.
(A–B) Distribution of CX3CR1+ MMs shown in cross-section (A) or muscularis sheet (B) of large bowel (LB) from Cx3cr1-GFP+/– mice. Scale bar – 100 nm. (C) Phenotype of MMs in small bowel (SB) muscularis from Cx3cr1-GFP+/– mice by FACS analysis (gated on DAPI– cells). (D) Flt3 and Csf1r gene expression in sorted MMs measured by whole mouse genome microarray and presented as relative units (RU). (E) FACS plots of whole bowel suspensions from WT or Cscf1r–/– mice show % of CD11cloMHCIIhi MMs (oval gate, solid line) and CD11chiMHCIIhi LP phagocytes (oval gate, dashed line). Gated on CD45+CD11clo/hiCD11blo/hi cells as demonstrated in Figure S1. (F) Absolute numbers of MMs in total gut of WT and Csf1r–/– mice quantified by FACS. (G) Relative reduction of MMs and CD103+CD11b+ and CD103–CD11b+ LP phagocytes in Csf1r–/– mice as compared to WT littermates (quantified by FACS). (H) % of WT CD45.1+ and Csf1r–/– CD45.2+ cells among CD45+ LP CD103+CD11b+ and LP CD103–CD11b+ phagocytes
and MMs (Muscularis) in SB from 10% WT + 90% Csf1r–/– mixed BM chimeras.

