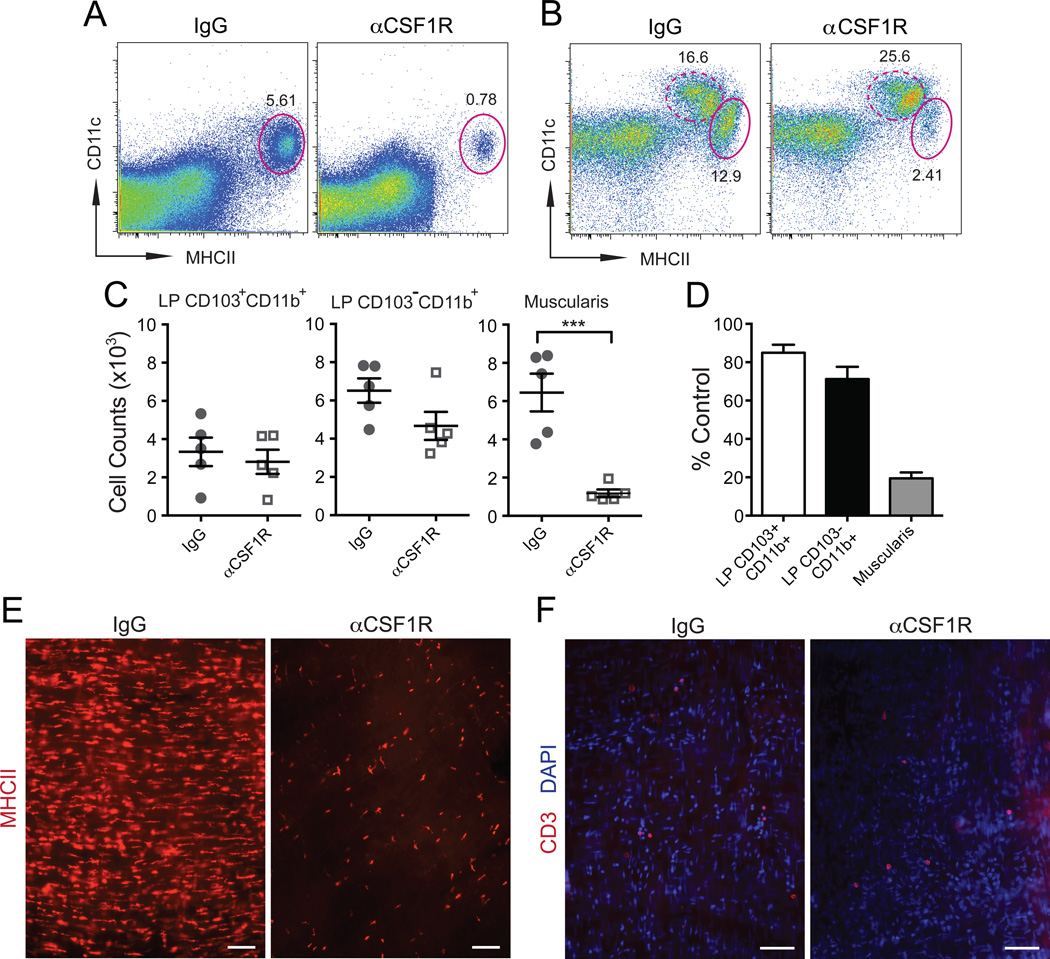
Figure 2. Model of MM depletion.
(A–B) FACS plots of separated SB muscularis (A) and whole SB (B) single cell suspensions from WT mice 2 days after i.p. injection of isotype IgG or αCSF1R mAb show % of CD11cloMHCIIhi MMs (oval gate, solid line) and CD11chiMHCIIhi LP phagocytes (oval gate, dashed line). A – gated on total viable cells. B – gated on CD45+CD11clo/hiCD11blo/hi cells using the gating strategy as in Figure S1. (C) Absolute numbers of LP CD103+CD11b+ and LP CD103–CD11b+ phagocyte and MMs (Muscularis) in SB of WT mice 2 days after i.p. injection with isotype IgG or αCSF1R mAb quantified by FACS. (D) Relative reduction of LP phagocyte and MM numbers quantified by FACS in WT mice treated with αCSF1R mAb (Day 2) as compared to isotype IgG treated mice. (E–F) Distribution of MHCII+ macrophages (E) and CD3+ T cells (F) in LB muscularis from WT mice 2 days after i.p. injection of isotype IgG or αCSF1R mAb analyzed by immunofluorescence (IF). Scale bars – 100 nm.

