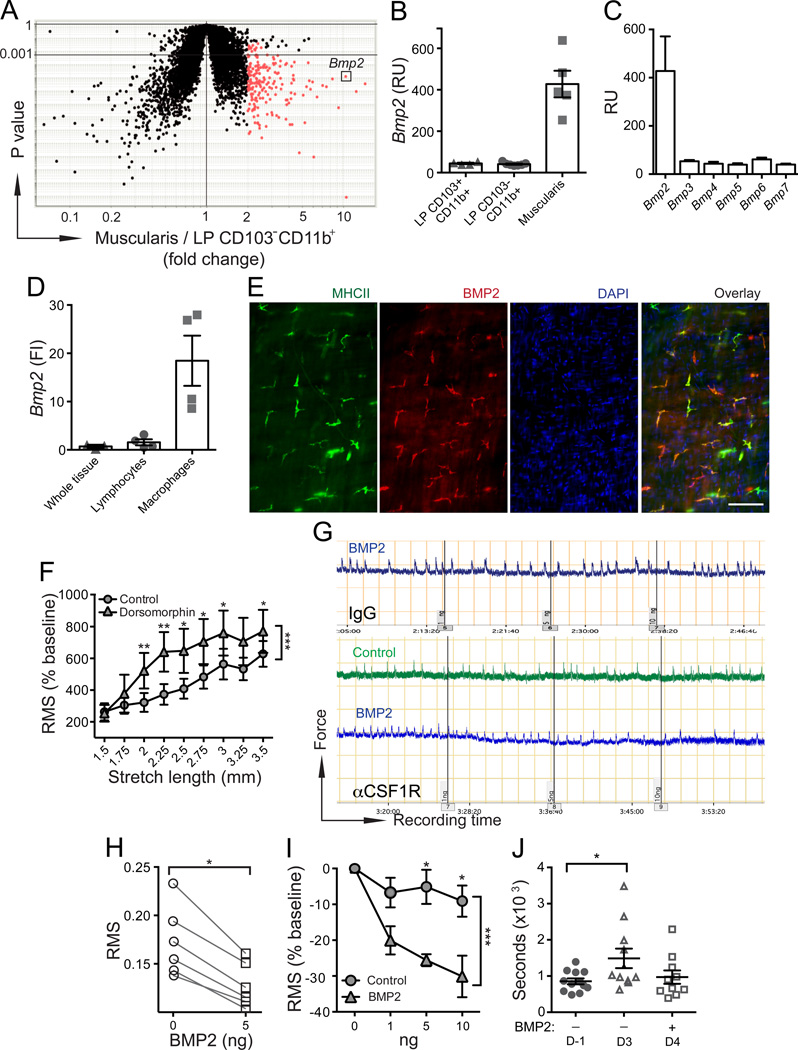
Figure 4. MMs regulate intestinal peristalsis by secreting BMP2.
(A–B) Bmp2 gene expression levels in MMs (Muscularis) compared to LP CD103–CD11b+ phagocytes (A) and LP CD103+CD11b+ and LP CD103–CD11b+ phagocytes (B) measured by whole mouse genome microarray. (C) Bmp2-7 gene expression levels in MMs measured by whole mouse genome microarray. (D) Bmp2 relative gene expression levels measured by qPCR in intact SB muscularis (whole tissue) or in SSCloCD45+CD11b– lymphocytes and macrophages sorted from separated SB muscularis. FI – fold increase as compared to “whole tissue”. (E) IF analysis of LB muscularis from WT mice stained with anti-BMP2 and anti-MHCII mAbs and counterstained with DAPI. Scale bar – 100 nm. (F) RMS of colonic contraction recordings normalized to baseline (%) at stretch intervals 1.5–3.5 mm. 3 mm colonic rings were obtained from WT mice treated with BMP receptor inhibitor dorsomorphin or control vehicle. (G) WT mice were injected i.p. with isotype IgG (top) or αCSF1R mAb (bottom) and analyzed 2 days later. Panels show ex vivo recordings of stretch-induced contractions of colonic rings from these mice before and after adding 1, 5 and 10 ng of human recombinant BMP2 or control vehicle (performed at 2.75 mm “optimal” stretch distance). (H) RMS of 10 min recordings described in F (bottom panel, αCSF1R mAb treated mice) before and after adding 5 ng of BMP2. (I) RMS normalized to baseline (%) of recordings described in F (bottom panel, αCSF1R mAb treated mice) after adding BMP2 (1, 5, 10 ng) or control vehicle. Baseline here is the recording at the same stretch distance (2.75 mm) prior to adding BMP2 or control vehicle. (J) Colonic transit time measured by bead expulsion assay in WT mice prior receiving αCSF1R mAb (day −1) and on days 3 and 4 after receiving αCSF1R mAb; 18 and 3 hours prior the last assessment (day 4) mice received 1 µg of BMP2 i.p.

