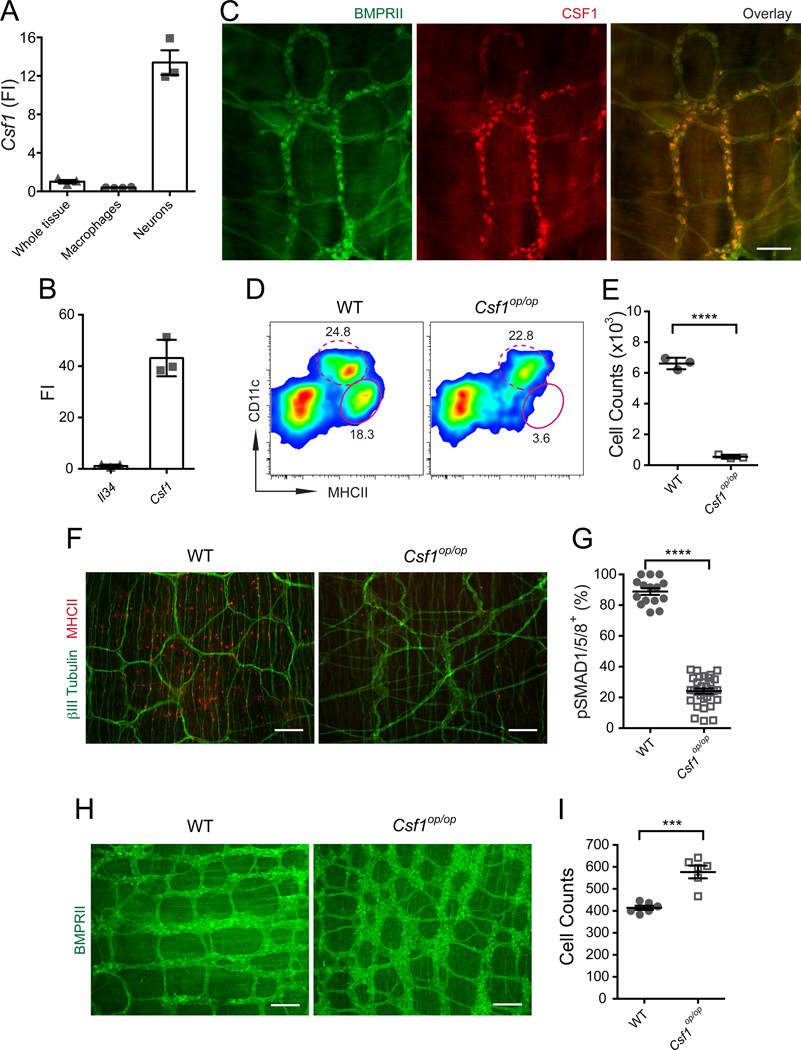
Figure 6. Enteric neurons produce CSF1 required for MM development.
(A) Csf1 gene expression levels measured by qPCR in intact muscularis (whole tissue), macrophages sorted from SB muscularis and cultured primary enteric neurons (FI compared to the “whole tissue”). (B) Il-34 and Csf1 relative gene expression levels (FI) measured by qPCR in cultured enteric neurons as compared to Il-34. (C) IF analysis of LB muscularis from WT mice stained with anti-BMPRII and anti-CSF1 Abs. Scale bar – 100 nm. (D) FACS plots of whole bowel single cell suspensions from WT mice and their Csf1op/op littermates show % of CD11cloMHCIIhi MMs (oval gate, solid line) and CD11chiMHCIIhi LP phagocytes (oval gate, dashed line). Gated on CD45+CD11clo/hiCD11blo/hi cells (E) Absolute MM numbers in the bowel of WT mice and Csf1op/op mice quantified by FACS. (F) IF analysis of LB (cecum) muscularis from WT mice and their Csf1op/op littermates stained with anti- βIII Tubulin and anti-MHCII Abs. Scale bars – 500 nm. (G) Quantitative summary of the distribution of pSMAD1/5/8+BMPRII+ neurons in the LB muscularis from WT and Csf1op/op mice. Each data point represents % of pSMAD1/5/8+ neurons among total BMPRII+ neurons in each visual field; each column summarizes the results from three animals. (H) IF analysis of LB (colon) muscularis from WT and Csf1op/op littermates stained with anti-BMPRII Ab. Scale bars – 500 nm. (I) Quantitative summary of the distribution of BMPRII+ neurons in the colon of WT and Csf1op/op mice. Each data point represents the counts of BMPRII+ neurons in each visual field; each column summarizes the results from two animals.

