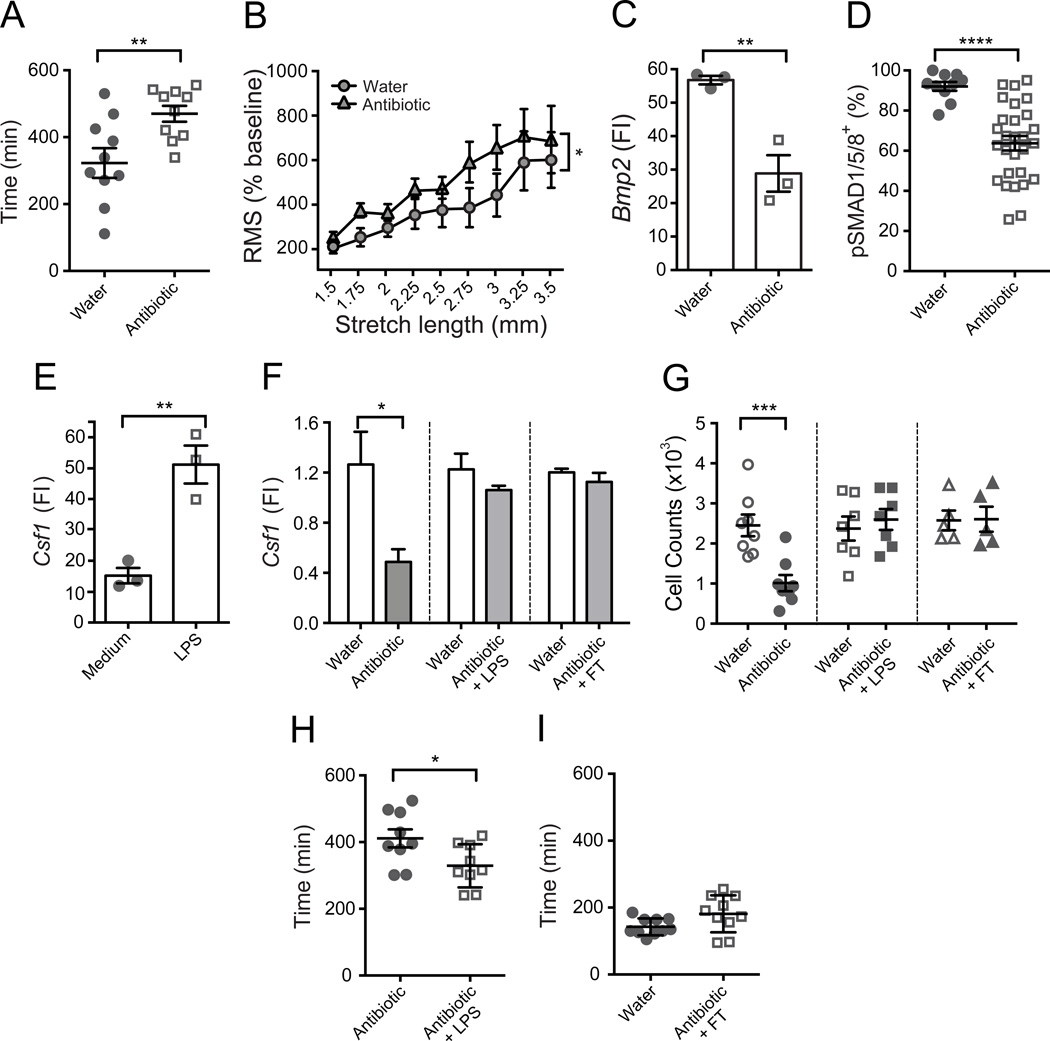
Figure 7. Luminal microbiota regulates intestinal motility and MM-neuronal crosstalk.
(A–D) WT mice received antibiotics with drinking water for 4 weeks and control age matched mice received only water. (A) Total GI transit time that represents the time required to expel feces containing carmine red dye measured in antibiotic-treated and control mice. (B) RMS of colonic contraction recordings normalized to baseline (%) at stretch intervals 1.5–3.5 mm. 3 mm colonic rings were obtained from antibiotic-treated and control mice. (C) Bmp2 relative gene expression levels measured by qPCR in macrophages sorted from separated SB muscularis of antibiotic-treated and control mice. FI – fold increase as compared to Bmp2 levels in the intact muscularis. Each data point represents qPCR results obtained from analyzing 50,000 cells after a single sort from 5 mice. Cell sorting from each group was performed in pairs, on the same day and under identical conditions. (D) Quantitative summary of the distribution of pSMAD1/5/8+BMPRII+ neurons in the muscularis from antibiotic-treated and control mice. Each data point represents % of pSMAD1/5/8+ neurons among total BMPRII+ neurons in each visual field; each column summarizes the results from three animals. (E) Csf1 relative gene expression levels in cultured primary enteric neurons measured by qPCR. Differentiated neurons were cultured with or without 10 ng/ml of LPS for 18 hrs prior to analyses. FI – fold increase as compared to Csf1 levels in the intact muscularis. Each data point represents qPCR results obtained from an independent neuronal culture. FI – fold increase as compared to Csf1 levels in the intact muscularis. (F) Csf1 relative gene expression levels quantified by qPCR in LB muscularis from WT mice were treated with antibiotics for 4 weeks (left), from WT mice treated with antibiotics and 50 µg/ml LPS in drinking water for 4 weeks (middle) and from WT mice 3 weeks after they received fecal transfer (FT) following a 4-week course of antibiotics (right). The data are compared to age matched control mice received only water. FI – fold increase as compared to average Csf1 levels in the control group received water. (G) Absolute numbers of MMs quantified by FACS in LB from WT mice received antibiotics (left), antibiotics with LPS (middle) and FT following antibiotic treatment (right) as in F. The data are compared to age matched control mice received only water. (H) Total GI transit time in WT mice received antibiotics and 50 µg/ml LPS with drinking water for 4 weeks and age matched mice that received only antibiotics for 4 weeks. (I) Total GI transit time in WT mice 3 weeks after they received FT following a 4-week course of antibiotics and control mice received water.

