
Figure 7.
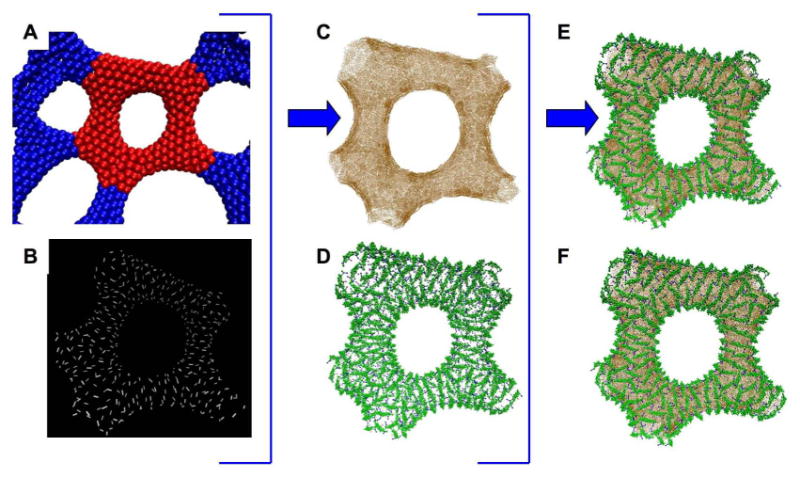
Reconstructing a more complex remodeled membrane topology. The original mesoscopic EM2 simulation structure is shown in panel A, with the reconstructed area highlighted in red. Panel B shows the direction of the larger of the two principal curvatures associated with each EM2 quasiparticle. Panels C and D show the initial CG membrane and protein configurations, panel E shows the merged configuration before relaxation, heating, and simulation. Panel F shows that configuration after 10 million CG MD timesteps at 300 K. Note the striations around the torus, reminiscent of those observed in the experimental EM image, Figure 2 panel B.