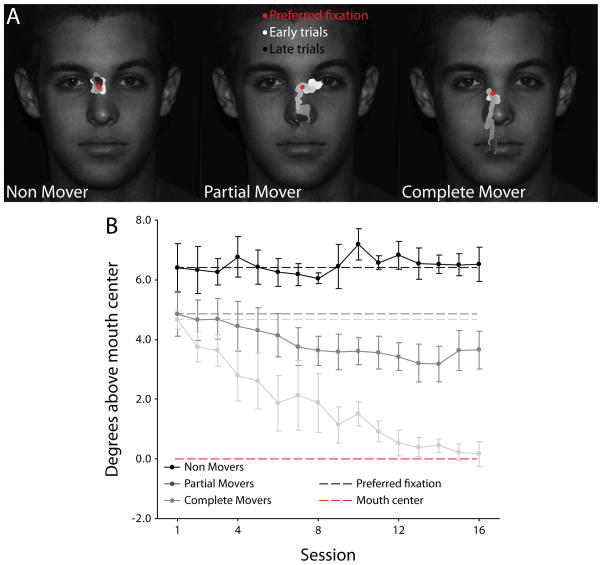
Fig. 4.
Three different observer types based on eye movement behavior. (A) Each observer fell into one of three categories based on the extent of their eye movement modulation. Representative observers are shown for each group, with the red dot indicating the observer’s preferred point of fixation for normal faces and the white (early sessions) to black (late sessions) trace showing the observer’s average fixation location with a 50-trial moving window. (B) Group data averaged across observers showing mean fixation location in the vertical dimension as a function of session. Grey dotted lines indicate each group’s average preferred fixation for normal faces. Red dotted line indicates the center of the informative mouth region. Error bars represent one standard error of the mean (SEM) across observers.

