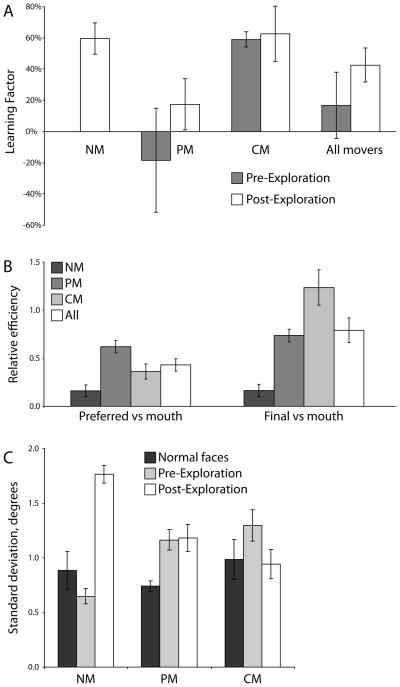
Fig. 8.
Predictors of learning. (A) Percentage of total learning due to eye movement modulation above and beyond covert mechanisms is quantified using the Learning Factor. Before guided exploration, only CMs saw a definitive advantage when allowed to choose their gaze behavior. All groups benefited once the stimulus was fully explored. (B) On the left, each group showed a different ability to extract information from their preferred point of fixation relative to optimal as measured by the relative efficiency metric. On the right, pre-exploration eye movement strategy efficacies are reflected in each group’s efficiency at the their final fixation location versus optimal. (C) The average spread of each observer’s fixations when identifying normal faces versus novel composite faces. Error bars represent one SEM across observers.

