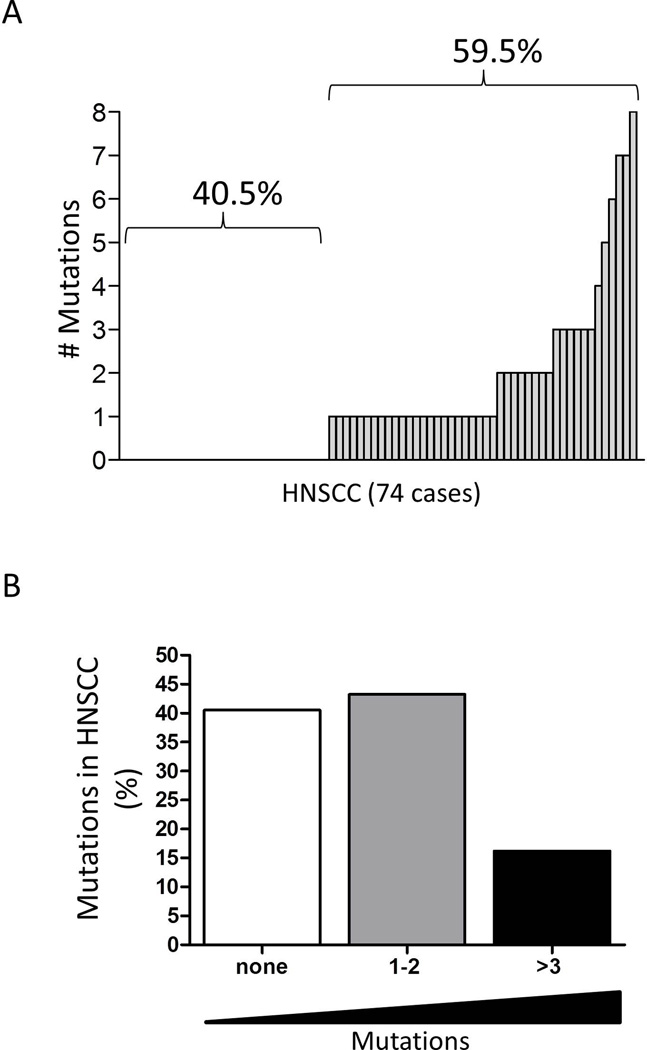
Figure 1. HNSCC mutations in histones and histone associated transcription regulators.
(A) Bar graph of 74 sequenced HNSCC tumor samples [121] containing mutations in epigenetic associated genes that encode histones and their linkers, proteins associated with the recruitment of DNA-binding proteins, HDAC I and II interacting proteins, corepressor proteins and transcriptional activators and coactivators. (B) Bar graph depicting the percentage of mutations found in HNSCC samples (n=74). (Graph generated from the analysis of the HNSCC NGS supporting data published by Stransky et. al. 2011.

