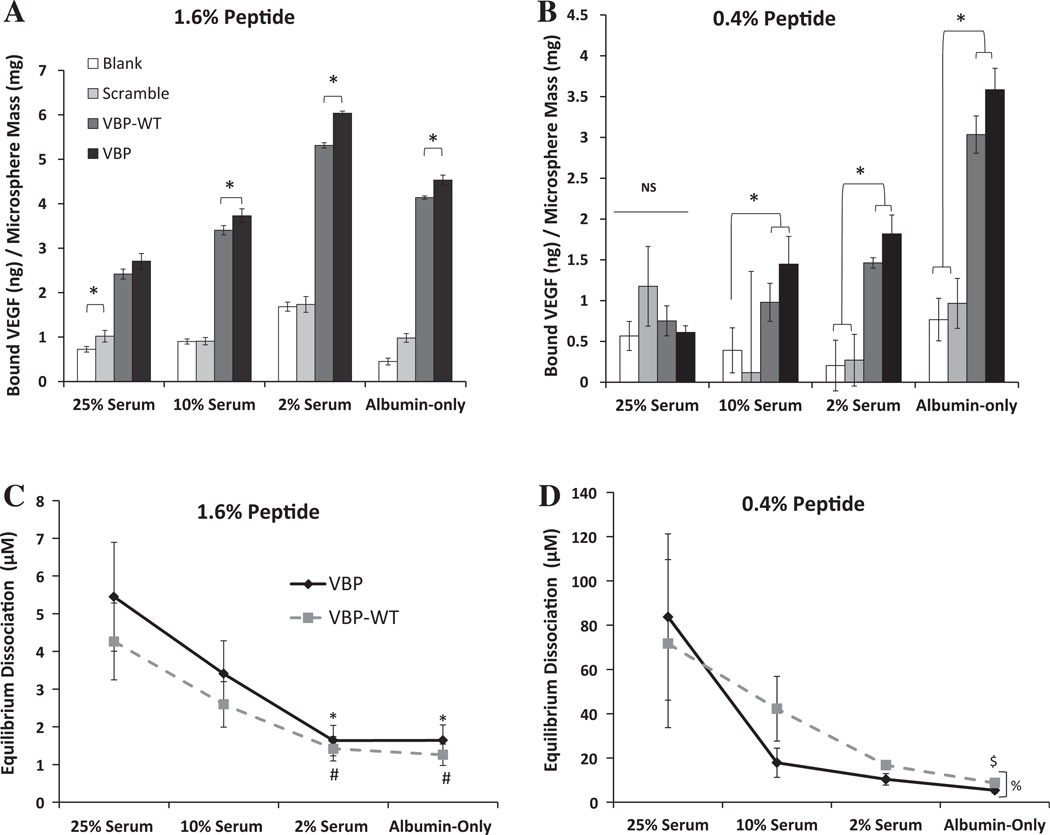
Fig. 2.
Comparison of VEGF binding to microspheres at higher and lower peptide density in various FBS-containing solutions (25 vol.% in PBS, 10 vol.% in PBS, 2 vol.% in PBS) and in albumin-only solution (1.25% w/v BSA in PBS), which mimics the total protein amount of 25% serum). (A) Bound VEGF for 1.6% peptide density. (B) Bound VEGF for 0.4% peptide density microspheres. Statistical significance in (A) and (B) is reported at p<0.05 and indicated by an asterisk. (C) Equilibrium dissociation constants for 1.6% microspheres. Significance is indicated by symbols representing a difference compared to VBP in 25% serum (*) or VBPWT in 25% serum (#). (D) Equilibrium dissociation constants for 0.4% microspheres. Significance is reported compared to VBP in 2% serum (&), and between VBP and VBPWT in albumin-only solution (%). Error bars represent 1 SD about the mean. Statistical significance is reported at p < 0.05.

