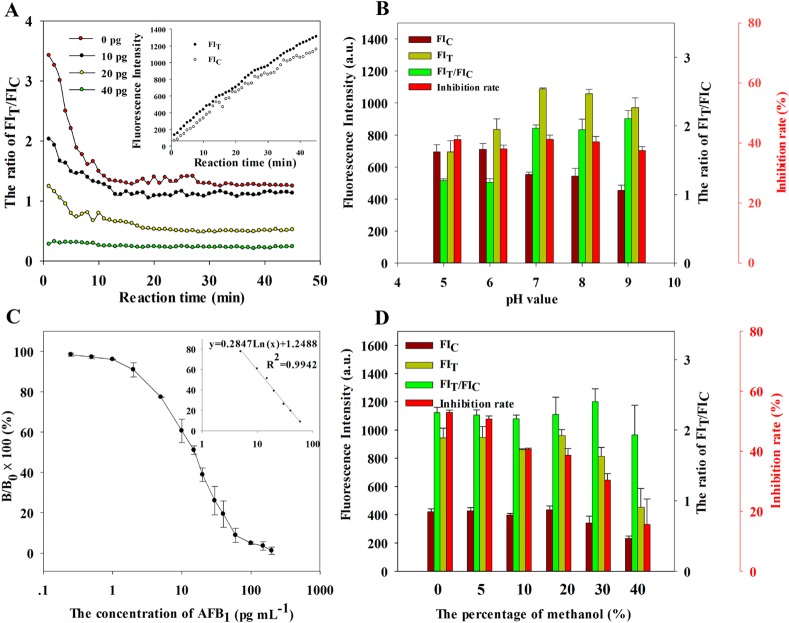
Figure 3.
(A) Immunoreaction dynamics of FIT/FIC at different AFB1 concentrations. (B) Effect of pH value of samples on FIT, FIC, and FIT/FIC ratio. Competitive inhibition rate was defined as (1 – B/B0) × 100%, where B0 and B represent FIT/FIC of the negative sample and an AFB1 spiked sample solution (10 pg mL–1), respectively. (C) Optimized standard inhibition curve for AFB1 was obtained by plotting the normalized signal B/B0 × 100% against the logarithm of AFB1 concentration. Data were obtained by averaging three independent experiments. (D) Effect of methanol in samples on FIT, FIC, and FIT/FIC ratio.

