
Figure 4.
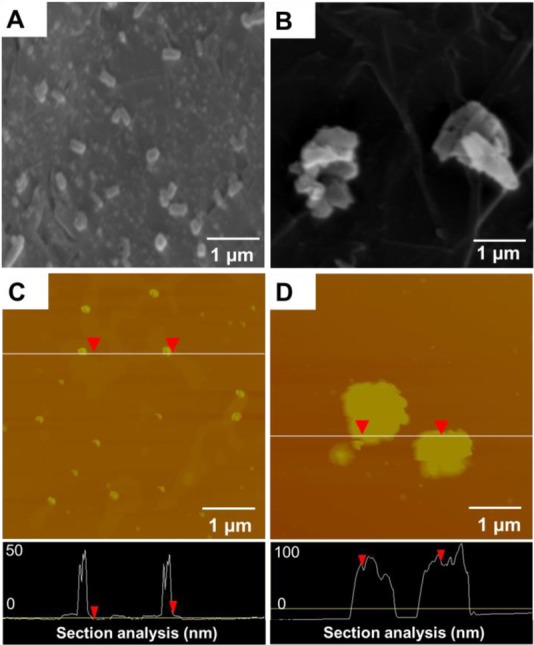
Nanostructures assembled from sericin with different molecular weights in HFA solutions. A and C are LS solution, and B and D are HS solution. A and B are SEM images. C and D are AFM images. The AFM section profile measurements of HS and LS are shown at the bottom of AFM image (black areas). The corresponding position of the black area is shown with red arrows and a white line in the original AFM images (C and D).