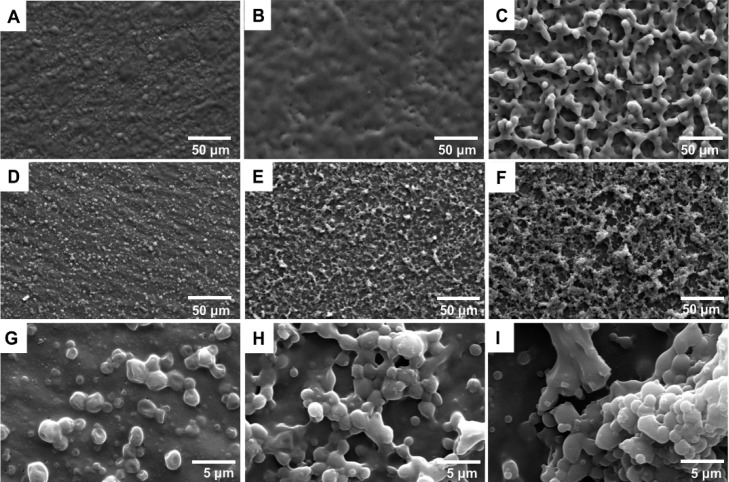
Figure 5.
FESEM images of microparticles prepared from LS with the concentration of (A) 5 wt %, (B) 7.5 wt %, and (C) 10 wt %. (D), (E), and (F) are samples corresponding to (A), (B), and (C) after treatment with methanol, respectively. (G), (H), and (I) are high magnification images corresponding to (D), (E), and (F), respectively.

