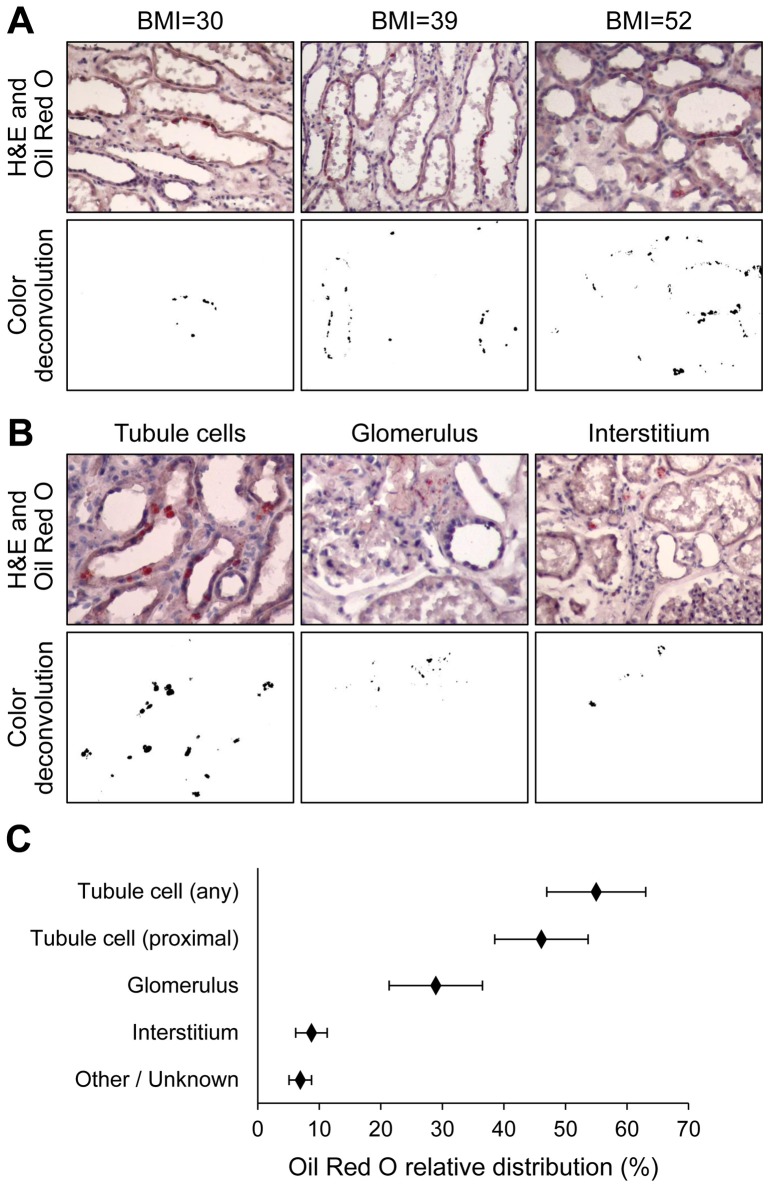
Figure 2. Lipid staining.
Kidney cortex sections were stained with Oil Red O and standard hematoxylin to visualize lipid localization within renal structures. After image acquisition, a computer-based color deconvolution and thresholding algorithm was used to separately visualize and quantify Oil Red O staining, with the original image serving as reference for the manual assignment of lipid staining to discrete structures (i.e. tubule cells, glomeruli, interstitium, other). A. Oil Red O staining was noted predominantly in proximal tubule cells, and generally increased with increasing body mass index (BMI). B. Examples of the localization of lipids within tubule cells, glomeruli and interstitium. C. Relative distribution of lipids within kidney structures based on Oil Red O staining quantified by color deconvolution in 29 study participants with available fixed tissue. Whiskers represent 95% confidence intervals.

