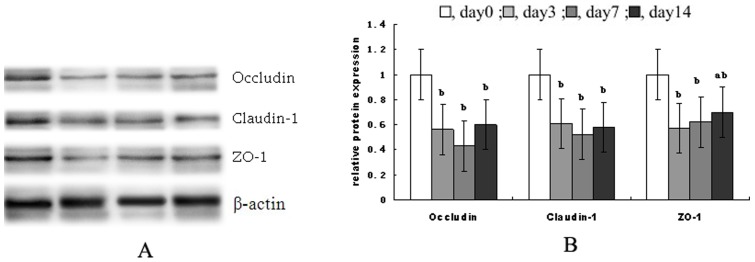
Figure 1. Tight junction protein levels of occludin, claudin-1 and zonula occludens-1 (ZO-1).
(A) shows representative blots of occludin, claudin, zonula occludens-1 (ZO-1), and β-actin on 0, 3, 7 and 14 post-weaning, respectively. (B) shows relative tight junction proteins expression. Data are means ± SD. a,bMeans with different letters differ significantly (P<0.05). The control sample on day 0 post-weaning was used as the reference sample. The protein expression of all samples was expressed as fold changes, calculated relative to the control group on day 0 post-weaning.

