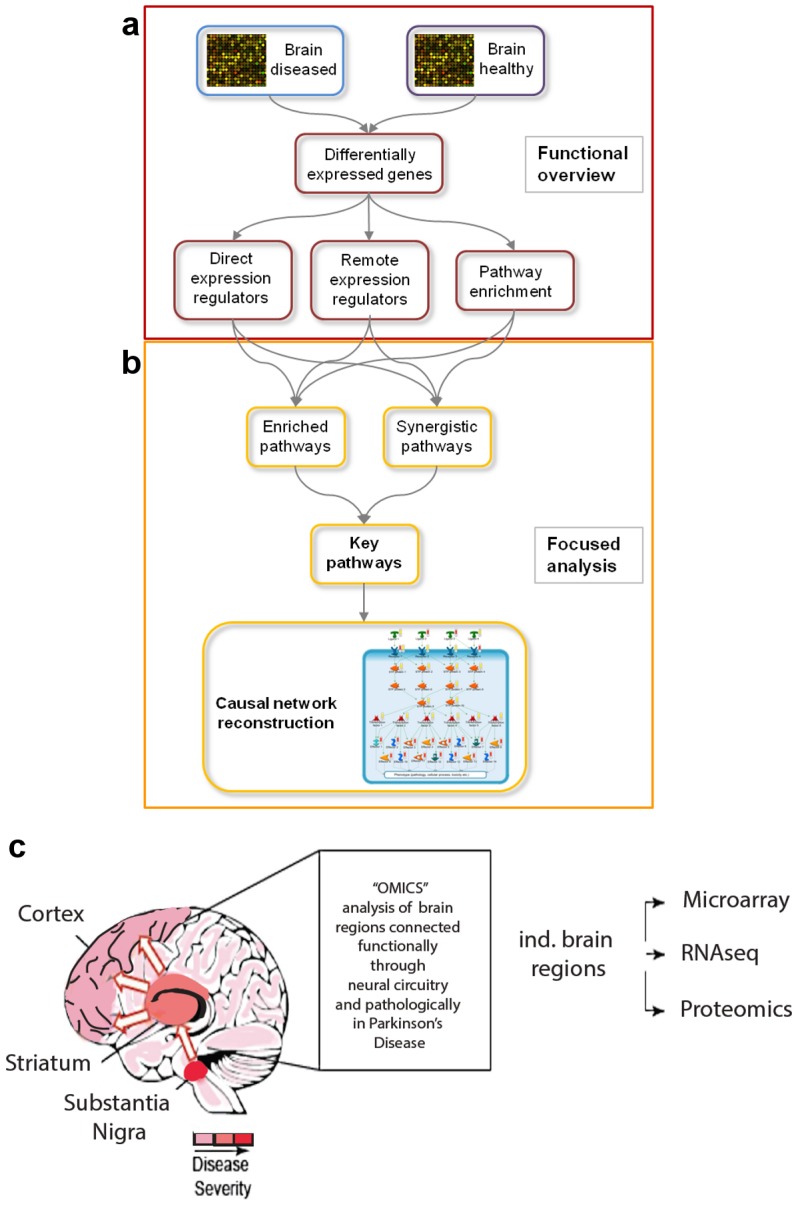
Figure 1. Overview of brain regions and methodology used in this study.

(a, b) Overview of workflow for functional overview and focused analysis. (a) Expression data for healthy and diseased brain regions are statistically analyzed to obtain differentially expressed genes (DEGs). In the first part, the functional overview, the DEGs are used to identify expression regulators as well as pathways that are significantly enriched with DEGs. (b) In the second part, the focused analysis, pathways that are significantly enriched with expression regulators are combined with pathways that are significantly enriched with DEGs. Combining the two-pathway enrichment results leads to the identification of key pathways, which are the basis for the reconstruction of causal networks. (c) Cartoon representation of different brain regions used in the study, and the associated disease severity of each region denoted by gradations of red. Also shown is connectivity between the substantia nigra, striatum and cortex and the three methods used to interrogate the brain regions (microarray, RNAseq and proteomics).
