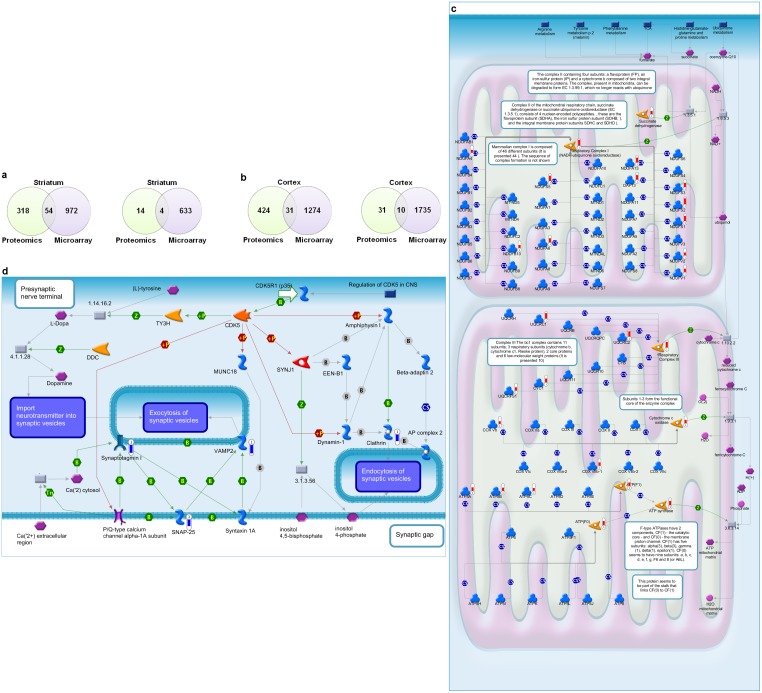
Figure 5. Protein alterations in PD brain are dominated by mitochondrial and lipid transport defects, and are largely independent of transcriptional changes.
(a) Overlap between proteins and differentially expressed genes in striatum, as measured by mass spectrometry and microarray technologies. The overlap of upregulated proteins/genes is shown on the left, the overlap of downregulated proteins/genes on the right. (b) Overlap between proteins and differentially expressed genes in PD cortex, as measured by proteomics and microarray technologies. The overlap of upregulated proteins/genes is shown on the left, the overlap of downregulated proteins/genes on the right. (c) Oxidative phosphorylation pathway. The most significantly enriched upregulated pathway for PD cortex based on proteomics data. Red thermometers represent proteins with increased abundance. (d) Regulation of CDK5 in presynaptic signaling. The most significantly enriched downregulated pathway for PD cortex based on proteomics data. Blue thermometers represent proteins with decreased abundance.

