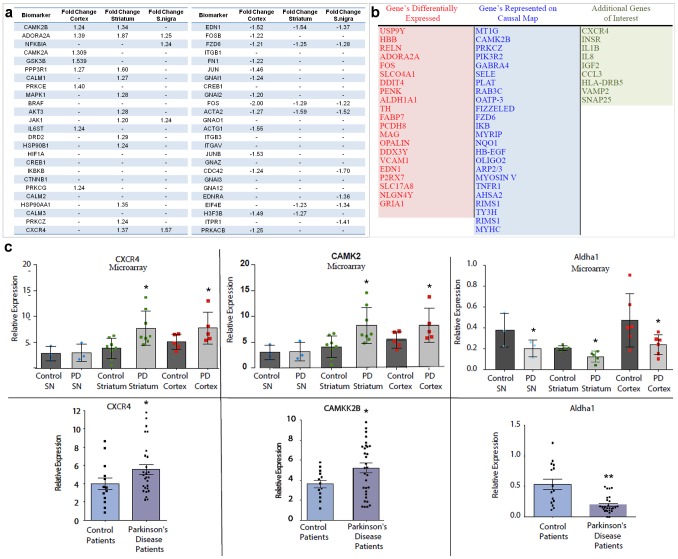
Figure 6. Tracking peripheral biomarkers identified from the causal mapping of PD brain.
(a) High confidence biomarkers consistently identified for PD cortex, striatum, and substantia nigra (S. nigra) using microarray analysis. Upregulated biomarkers are shown on the left together with fold changes in the three brain regions, downregulated biomarkers on the right. (b) Functional biomarker panel that combines DEGs, high confidence biomarkers shown in (a) and genes from the causal map. (c) Assessment of biomarkers in brain (top panels)(substantia nigra, SN) and blood (bottom panels) from age-matched control and PD patients using QuantiGene technology from Panomics. * p≤0.05 and ** p≤0.01 as determined using a two-tailed unpaired t-test with Welch's correction.

