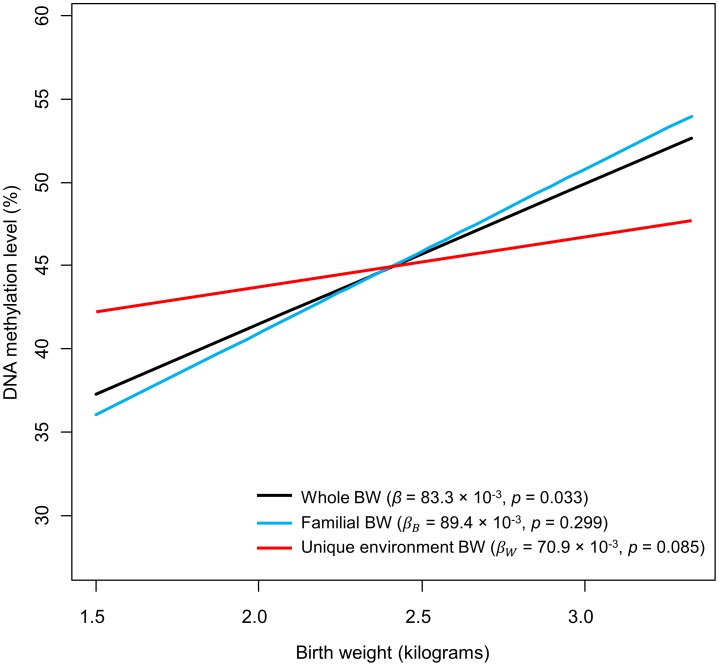
Figure 2. Representation of the association between birth weight and DNA methylation level of cg07075026 and cg20966754.
The black line (“Whole BW”) was obtained from the first regression test (i.e., using raw BW from each of the 34 individuals), whereas blue and red lines (“Familial BW” and “Unique environment BW”) represent outcomes from the model evaluating familial and unique environmental factors.

