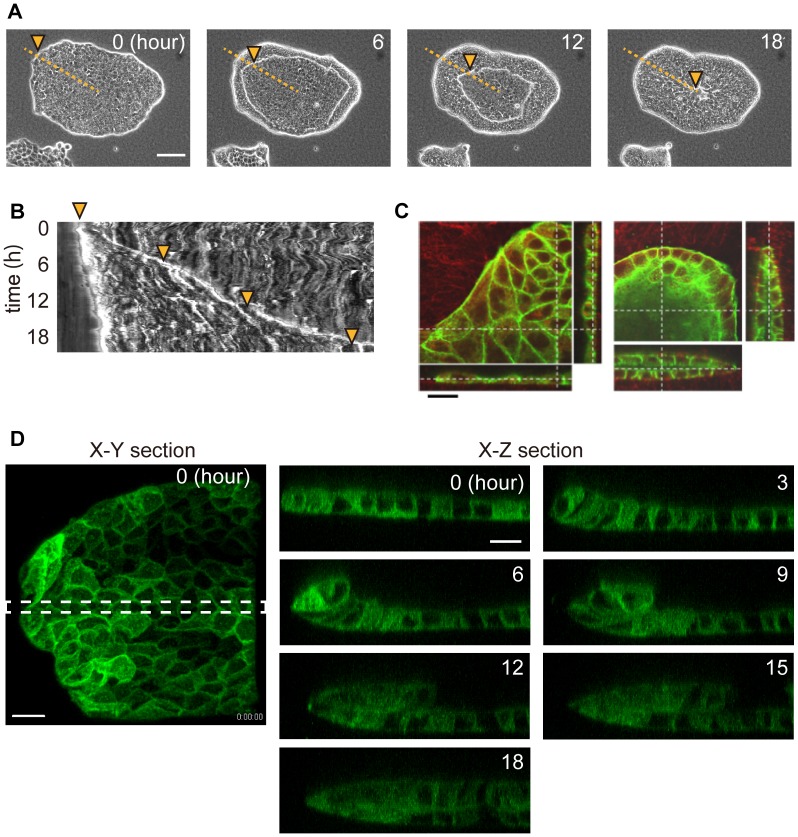
Figure 2. Epithelial sheets formed luminal structures by folding after the collagen gel overlay.
(A) Time-lapse images of an epithelial colony after the collagen gel overlay. Images were acquired using a phase contrast microscope. Numbers in the images represent the relative time from the start of the observation. The orange dotted line corresponds to the horizontal axis of the kymograph in Fig. 2B . The orange arrowheads indicate the position of the leading edge of the MDCK sheets, and they correspond with the kymograph. Bar = 100 µm. (B) Kymograph of epithelial folding. (C) Fluorescent images of F-actin (green) and collagen (red). Bar = 20 µm. (D) Images were acquired using a confocal fluorescence microscope. Green represents AG-CAAX (plasma membrane domain). X-Z sectional views were merged from the area indicated by the dotted line in an X-Y sectional view. Bar = 20 µm.

