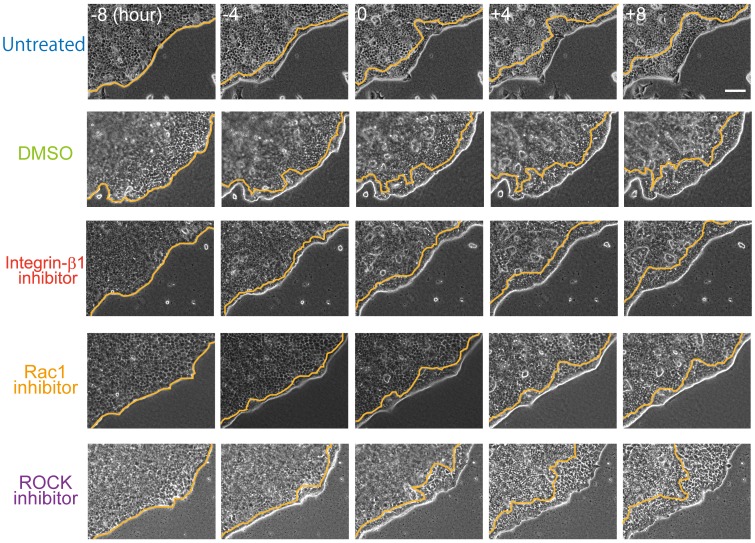
Figure 3. Temporal sequence of folding in the presence of an inhibitor.
Integrin-β1 inhibitor (AIIB2, 100 ng/ml); Rac1 inhibitor (Z62954982, 100 µM), ROCK inhibitor (Y27632, 10 µM); DMSO was used as a control for the Rac1 inhibitor. Each reagent was added at time zero. Orange lines represent the leading edges of the folding sheet. Numbers in the images denote the observation time (h). Bar = 100 µm.

