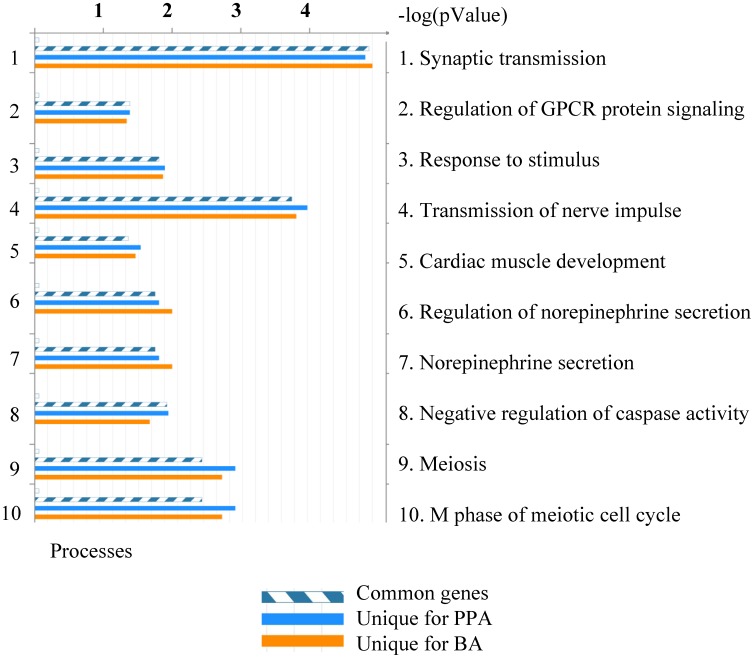
Figure 4. Enrichment analysis of differentially expressed genes: distribution by gene ontology (GO) processes.
Differentially expressed genes in BA and PPA groups (t-test compared to control group p<0.01) were subjected to enrichment analysis (which consists of matching gene IDs for the common, similar and unique sets of the uploaded files with gene IDs in functional ontologies in MetaCore). The figure illustrates the distribution by GO processes. The gene content is aligned between all uploaded files. The set of common gene IDs is marked as blue and white stripes. The unique genes for the files are marked as colored bars (BA - orange; PPA- blue). The sorting was done by common gene IDs; p-value was set for 0.05; both signals (induced and repressed) were included. The data shown are for sorting method “similarity by”. The degree of “relevance” to different categories for the uploaded datasets is defined by p values, so that the lower p-value gets higher priority. The top 10 processes are listed based on their −log (p-value).

