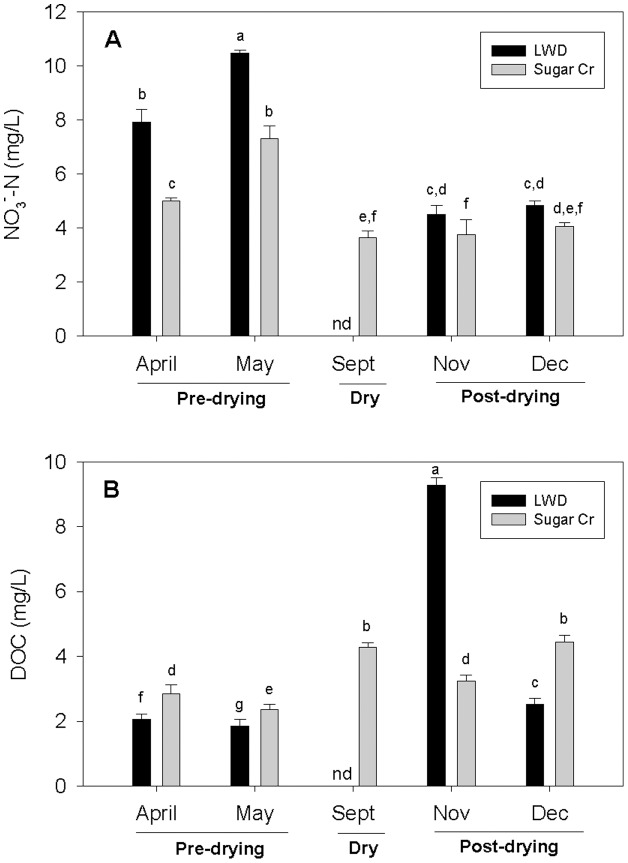
Figure 1. Nitrate and dissolved organic carbon concentrations in study streams.
(A) Mean NO3 - concentrations (mg N/L) by stream for each date. (B) Mean dissolved organic carbon (DOC) concentrations (mg/L) by stream for each date. Pre-drying indicates LWD had flow; dry, no flow; post-drying, flow returned. Letters indicate significant differences (p<0.05) based on Tukey's post hoc multiple comparisons (note the highest value will always be ‘a’). Error bars indicate +1 SE.

