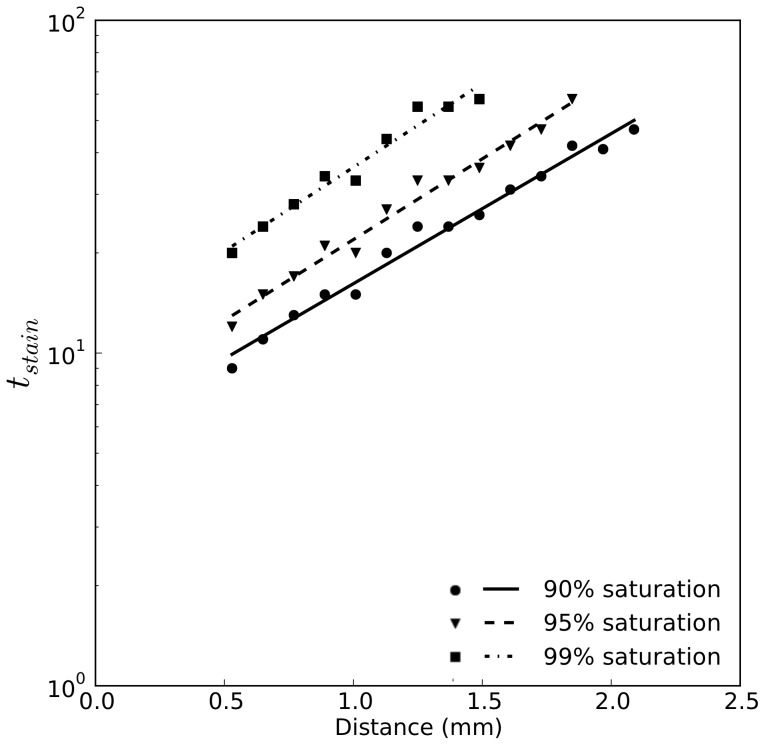
Figure 5. Semi-logarithmic plot of the required staining time for different levels  saturation as a function of distance.
Curves are fitted according to equation 2 and with fitted coefficients given in Table 1.

