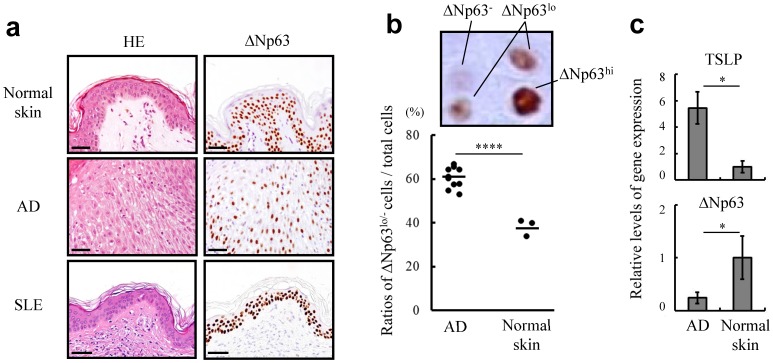
Figure 5. Unique expression profiles of ΔNp63 in AD epidermal lesions.
(a) Immunohistochemical staining of ΔNp63 in normal skin and skin lesions of AD and SLE. Consecutive sections of each condition were stained with hematoxylin and eosin (HE). Bar = 50 µm. (b) Level of ΔNp63 was classified into three categories depending on staining intensity, as indicated by ΔNp63hi, ΔNp63lo and ΔNp63−. The dot plot represents ratios of ΔNp63lo/- keratinocytes in normal skin (n = 3) and AD lesions (n = 10). (c) Quantitative RT-PCR demonstrating the levels of TSLP and ΔNp63 mRNAs in normal skin and AD lesions. Student's t test. *P<0.05 and ****P<0.001. Data are representative of at least three independent experiments.

