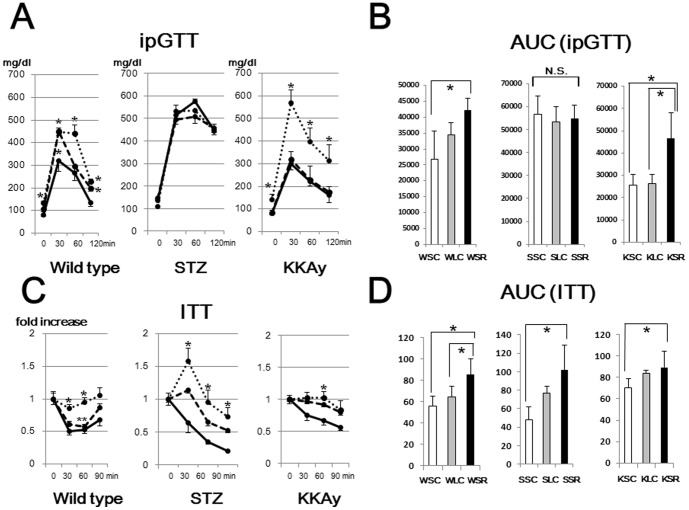
Figure 2. Intraperitoneal glucose tolerance test (ipGTT) and insulin tolerance test (ITT).
(A) Mice fed the SC diet (solid lines), LC diet (dashed lines) and SR diet (dotted lines) were fasted for 8 hr and glucose solution was administered intraperitoneally (2 mg/g body for wild type mice, 1.5 mg/g·body for diabetic mice). (B) Area under the curve (AUC) was calculated to measure the degree of the glucose tolerance impairment. (C) Mice in postprandial states were intraperitoneally injected with 1.0 U/kg·body human insulin. (D) AUC was calculated to measure the degree of the insulin tolerance impairment. *p<0.05 (vs corresponding mice fed the SC diet). **p<0.05 (vs corresponding mice fed the SR diet).

