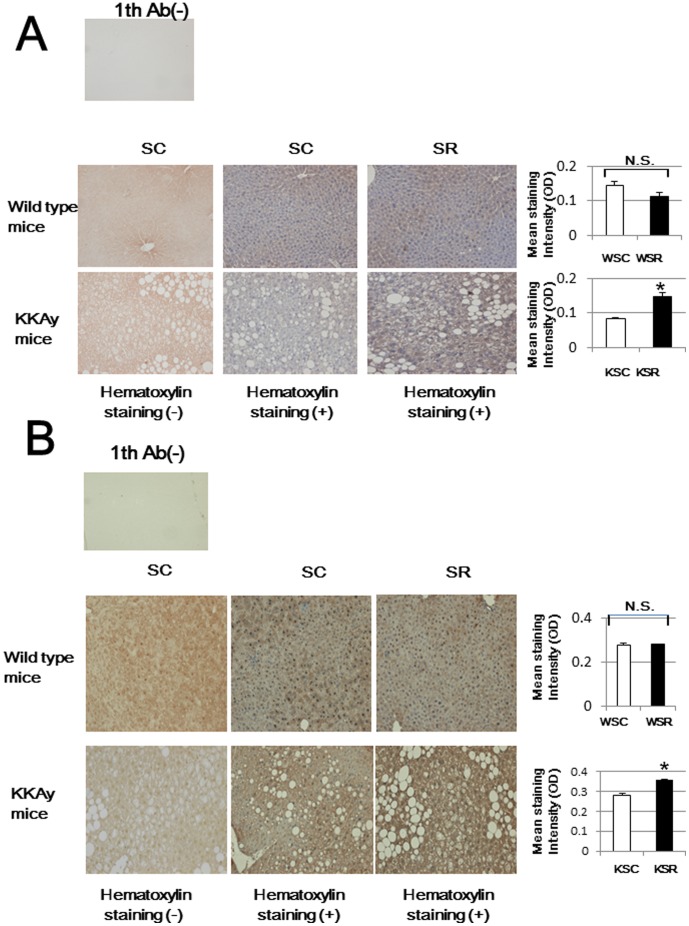
Figure 7. Immunohistochemistry for 4-HNE and 8-OHG.
Three optical fields of sections from each animal (n = 3) were randomly chosen and photomicrographed. Original magnification is ×50. The staining intensity was quantitated using Image J. Color images were first subjected to color deconvolution using G. Landini's plugin to obtain separate images of DAB and hematoxylin in gray scale. We measured the mean optical density of DAB staining in the cytoplasm for 4-HNE (A) and that in the area of nuclei for 8-OHG (B), applying binary mask images of nuclei created from hematoxylin images, and evaluated the staining intensity. Upper panels are negative controls, lacking primary antibody. One representative image of wild type (middle panels) and KKAy (lower panels) mice, fed the SC diet (left panels: without hematoxylin staining, middle panels: with hematoxylin staining) and the SR diet (right panels: with hematoxylin staining) is presented. Right bar graphs show staining intensity averages. *p<0.05 (KSC vs. KSR mice).

