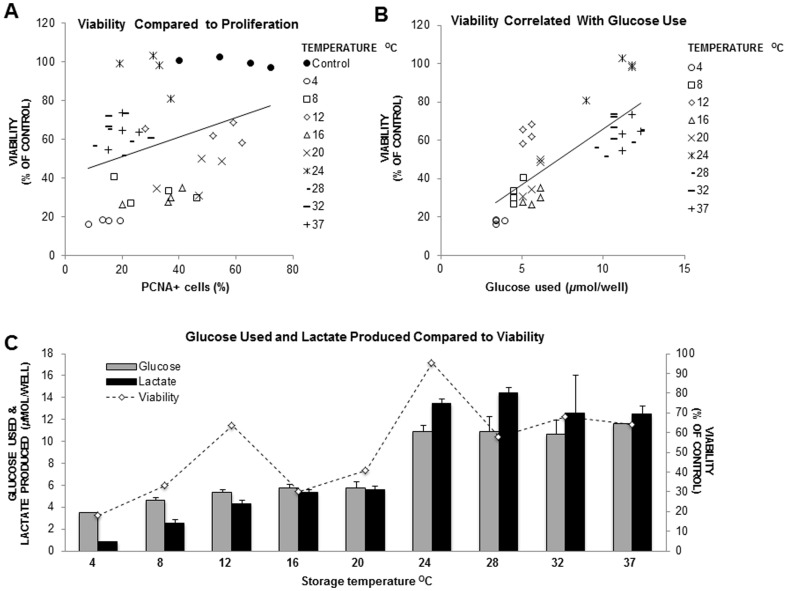
Figure 2. Cell viability comparison with PCNA, glucose use, and lactate production.
(A) Correlation between cell viability and PCNA expression shows a distinct separation between high and low temperatures within the dataset (r = 0.316; p < 0.05). (B) Cell viability was also correlated with glucose use (r = 0.782; p < 0.001). (C) Cell viability compared to metabolic values by temperature. Values represent the average seen in n = 4 wells of a 12 well plate at each temperature.

