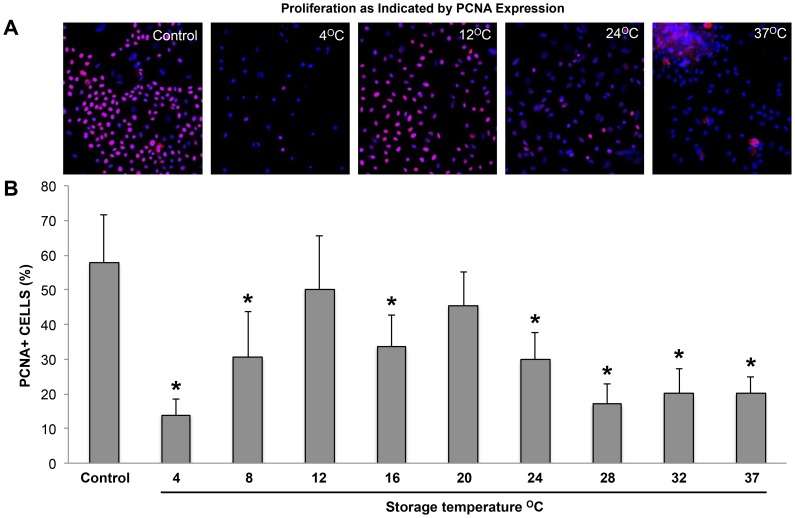
Figure 6. Proliferation as indicated by PCNA positive cells.
(A) Representative images of PCNA staining (TRITC - red) combined with nuclear staining (DAPI – blue) showing 4°C, 12°C, 24°C and 37°C compared to non-stored control. Expression was significantly reduced at all temperatures (* = significantly reduced, p < 0.05) except at 12°C and 20°C (B); significantly higher PCNA expression was seen at 12°C with 50 ± 15% and 20°C with 46 ± 10%, where values were comparable to the control value of 57 ± 14% (p = 0.983 and 0.752, respectively).

