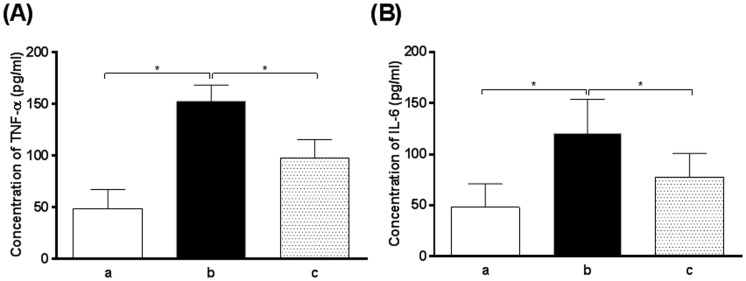
Figure 3. The concentrations of TNF-α and IL-6 in rat ileal tissues from different groups.
a: blank (normal) group; b: CCl4-treated rats receiving the vehicle only and c: oxymatrine treatment group. (A): The concentration of TNF-α in rat ileal tissues and (B): the concentration of IL-6 in rat ileal tissues. *P<0.01 by one-way ANOVA.

