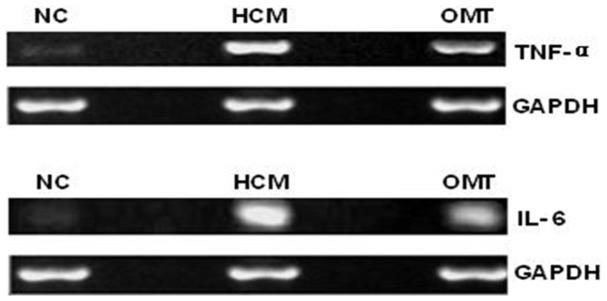
Figure 4. Representative bands for TNF-α and IL-6 mRNAs in rat ileal tissues from different groups.

RT-PCR was used to determine the levels of TNF-α and IL-6 mRNAs. GAPDH was applied as the control. Lane 1: blank (normal) group; Lane 2: CCl4-treated rats receiving the vehicle only group; and Lane 3: oxymatrine treatment group. TNF-α: tumor necrosis factor-α; IL-6: interleukin-6.
