
Figure 5.
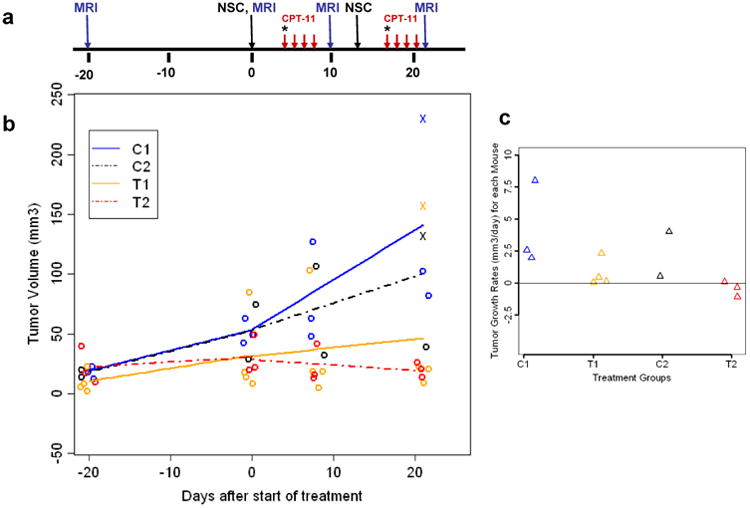
Statistical analysis: (a) Treatment schema for NSC-mediated CE enzyme/prodrug strategy for transgenic mouse medulloblastoma. Treatment regimens were as described in Figure 4. * Indicates a single dose of CPT-11 injection (37.5 mg/kg), red arrows indicate 4 doses of 20 mg/kg each. (b) Graph of the mean tumor growth rates and actual data points before and after treatment for each of the four study groups (C1, C2, T1, and T2). (c) Graph of the tumor growth rates after treatment by study group, calculated using linear regression of data for each mouse. Tumor volumes were evaluated using MRI data for each treatment (T1, T2) and control group (C1, C2).