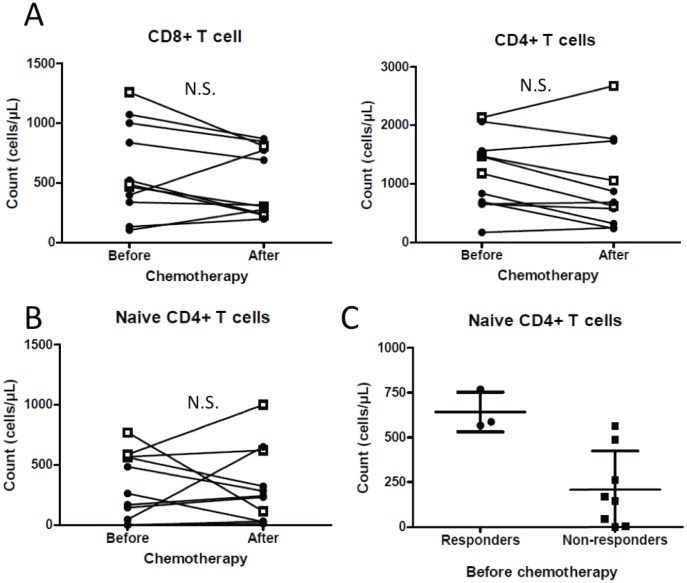
Figure 2. Treatment impacts T cell sub-populations.
Panel A shows CD8+ (left panel) and CD4+ (right panel) T cell counts before and after chemotherapy. B and C: Naïve CD4+ T cell counts before and after chemotherapy (B) and between patient groups (C). Black filled diamonds represent data from patients with progressive disease and white squares represent data from patients with disease control.

