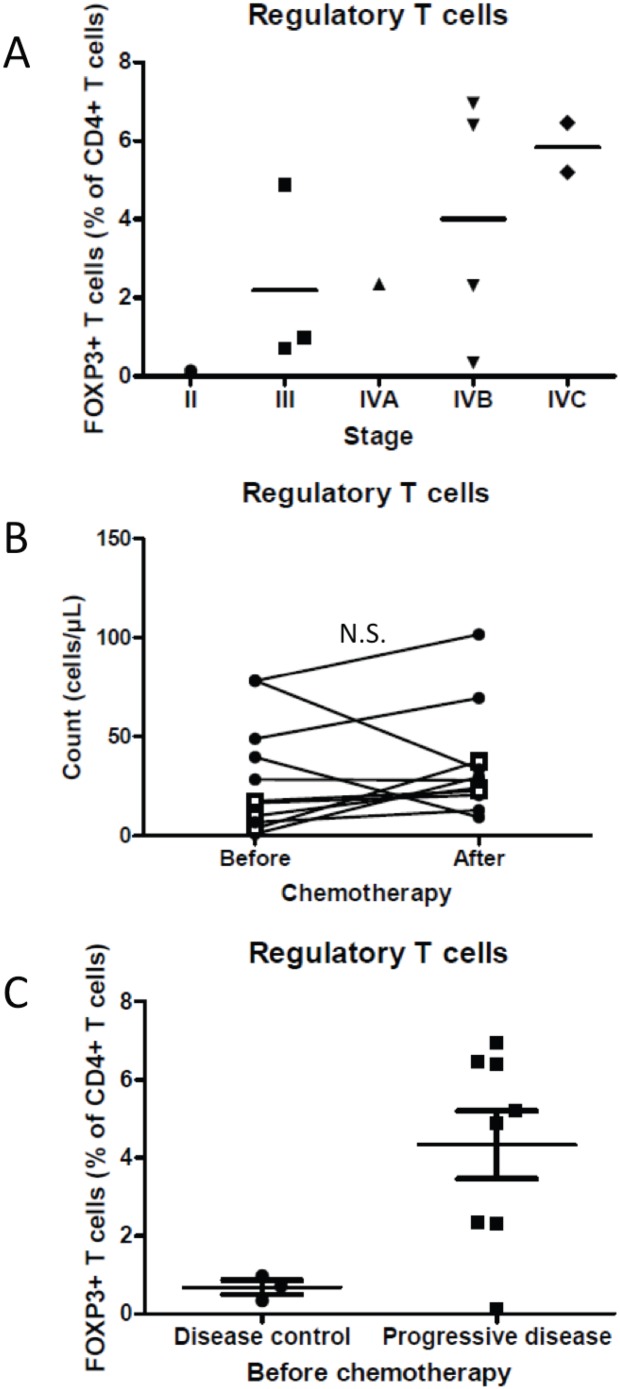
Figure 4. Regulatory T cells are associated with tumor grade and response to chemotherapy.
A: The proportion of FOXP3+ amongst CD4+ T cells (Treg) is depicted in function of tumor grade of the corresponding patient. B: Treg numbers are depicted before and after treatment with DTIC. Black filled diamonds represent data from patients with progressive disease and white squares represent data from patients with disease control. C: Proportion of Treg amongst CD4+ T cells.

