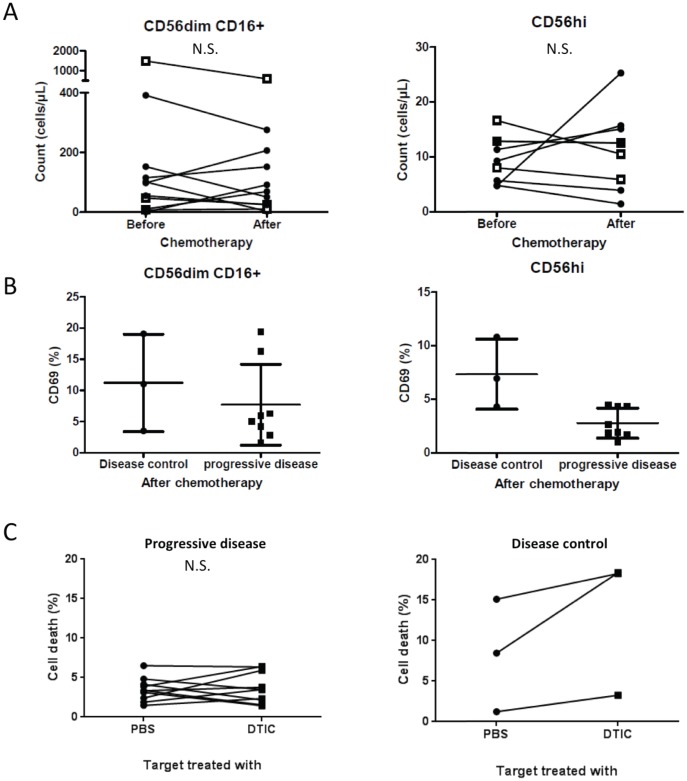
Figure 5. NK cell activity is related to chemotherapy response.
A: CD56dimCD16+ (left panel) cells and CD56hiCD16− (right panel) NK cells counts. Black filled diamonds represent data from patients with progressive disease and white squares represent data from patients with disease control. B: CD69 expression by CD56dimCD16+ (left panel) cells and CD56hiCD16− NK cells (right panel). C: Death of MelC cells pretreated with PBS or DTIC, and cocultured with NK cells isolated from patients.

