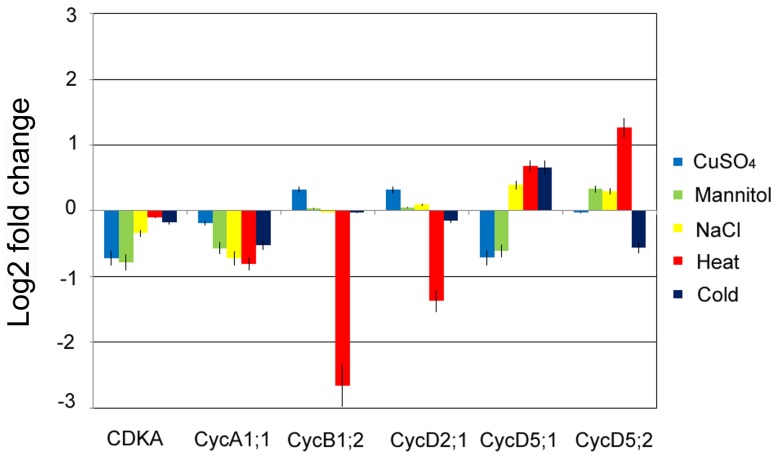
Figure 5. Expression change of CDKA, CycA1;1, CycB1;2, CycD2;1, CycD5;1 and CycD5;2 genes under abiotic stress.
RNA samples were extracted from the control and treatment groups for 24 h. Compared with gene expression of the control group by real-time PCR, fold change form averages of three biological replicates are shown.

