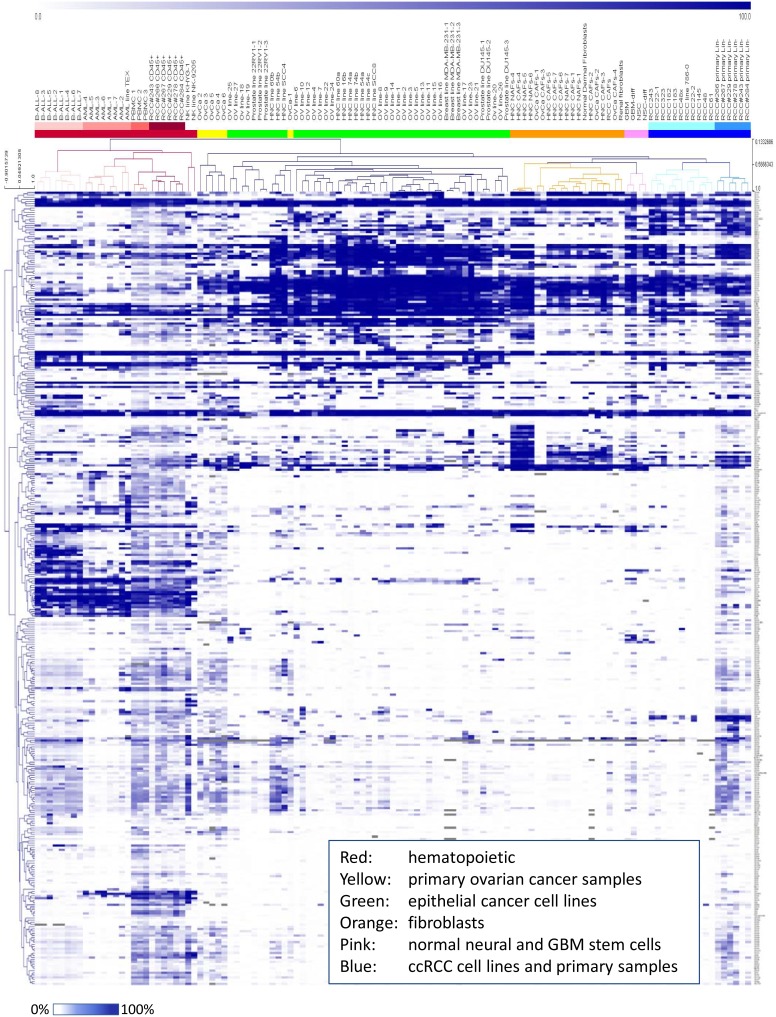
Figure 3. HT-FC allows phenotypic segregation and identification of cell samples from diverse lineages.
Unsupervised hierarchical clustering of percent-positive marker expression values generated on 119 samples was performed. Colours indicate emergence of biologically related samples into clusters based on surface marker profiles. See Figure S2 for a magnified image of the dendrogram.

